Dow Jones Update

Once this top is in place the index will fall to carry out a (C) wave. I count this down wave to be of intermediate degree.
 

Attachments

  • c.png
    c.png
    25.3 KB · Views: 443
Dow Jones Industrial Average
Tuesday, September 19th 2006

Short Term Trend - Bearish 10000 - 9800

Long Term Trend - Bullish 11500 - 12000

Dow - Short Term Outlook


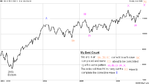
The Dow was able to float outside of the wedge today; however, we will need an expansion in price and volume to validate the move.


Dow%20091906.png


Dow - Long Term Outlook


Once we set the 4-year cycle low in early October, expect the Dow to retest the highs in the 11,500 area by the mid-December.

Nasdaq

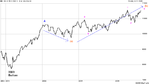
The Composite experienced more weakness today then the other indices, which is negative for the market since the Nasdaq leads the trends. A break of 2,200 will bring about additional selling.

The Nasdaq has fulfilled our original projection of the 2230 - 2250 area as forecasted in our archived updates. The Nasdaq is currently testing 3 areas of resistance (1) previous support line from the '04 swing low, (2) 61.8% retracement of the late April top and (3) previous support area at 2250 which preceded the false breakout to the April high of 2378.32. Expect a pullback to the recent low of 2012 in the coming weeks, and potentially a test of the 1850 - 1750 region.

Comp%20091906.png


S&P

The S&P broke out of the wedge today, only to close back above the support line. Expect the Fed decision on 9/20 news to resolve this back and forth pattern in the S&P.

The S&P like the Dow is completing a wedge formation with a first target of 1290.93 and then the 1168 area. Again, verify both price and volume to verify the break of the wedge.

S&P%20091906.png


Oil Market

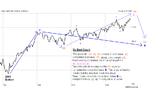
Another huge down day in the Oil Market. Longs sit tight, a tradeable bottom will be in place in the coming days.

The Oil Market is set to bounce in the coming days. Expect this technical reaction of the recent sell off to generate weakness in the market. Look at the chart below and you will see that every major bottom is accompanied with the -DI crossing below the -ADX line in the 40 area.

Oil%20091906.png


XAU

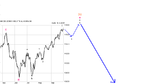
The XAU took another hit today, but this volatility is consistent with a bottom formation after a steep decline.. Like the Oil Market, the golds are putting in a bottom and should shortly began to experience a technical bounce. Expect the XAU to fill one or more of the gaps in the 140 area.

XAU%20091906.png
 
Thats my longs closed. Have rode the last part of this wave up far enough to bank profits and am now looking to short the index as it falls to carry out a (C) wave down of intermediate degree. (If the index follows my best count of course.)
 

Attachments

  • d.png
    d.png
    22.9 KB · Views: 234
newschoolwaver said:
The Dow closed at new highs for the year. It is now in the shorting territory I have been waiting for.

I am currently short on an october contract @ 11681 I am targeting the 11381 to 11350 region as a correction zone before it goes higher.........what sort of c wave are you looking at....just curious
 
It should be of intermediate degree which should take it down to or below the A wave of the same degree. This bottomed below 10,000.
 
info re tick

Can anyone tell me where the NYSE tick index is quoted in real time? The NYSE website seems not to have heard of it.
regards
Stephen
 
Hi All,

Just as a general comment, I think this week will be particularly interesting for the DOW.

The index has tried for 2 days running to break through it's record high and failed on both occasions.

I'm being cautious on the long side at the moment.


Thanks

Damian
 
damianoakley said:
Hi All,

Just as a general comment, I think this week will be particularly interesting for the DOW.

The index has tried for 2 days running to break through it's record high and failed on both occasions.

I'm being cautious on the long side at the moment.


Thanks

Damian

Dow Jones Industrial Average
Monday, October 2nd 2006

Short Term Trend - ***REVISED***Bearish 10900 - 10700

Long Term Trend - Bullish 11500 - 12000

Dow - Short Term Outlook


The Dow peformed strongly today compared to the other indices. We have developed a head and shoulders pattern on the 60-minute chart and a break of 11,660 would give us a target of 11,580. Shorts should wait for a break of the red line in the below chart before opening new short positions. If we are able to close below the May high of 11,760.19 tomorrow, this would imply the recent move was a false break to the upside and we will be headed for a retest of the 10,700 level.


Dow - Long Term Outlook


Dow%20100206.png


Expect the Dow to retest the double bottom area from the summer lows in the 10,700 - 10,900 area by mid-December.

Dow%20100206_v2.png


Nasdaq

The Nasdaq fell back through the support line from '04 and the .618 retracement from the April high to the July low. Expect the Nasdaq to accelerate to the downside over the coming weeks.

The Nasdaq has fulfilled our original projection of the 2230 - 2250 area as forecasted in our archived updates. The Nasdaq is currently testing 3 areas of resistance (1) previous support line from the '04 swing low, (2) 61.8% retracement of the late April top and (3) previous support area at 2250 which preceded the false breakout to the April high of 2378.32. Expect a pullback to the recent low of 2012 in the coming weeks, and potentially a test of the 1850 - 1750 region.

Comp%20100206.png


S&P

The wedge on the S&P has gotten a bit messy over the last couple of weeks, but there are 2 major support lines in play. Below you will see the red line from the July bottom, and also the purple line which has been provided support since early September. Shorts should look to open new positions on a break of the purple line. Expect more weakness in the S&P over the coming weeks.

S&P%20100206.png


The S&P like the Dow is completing a wedge formation with a first target of 1290.93 and then the 1168 area. Again, verify both price and volume to verify the break of the wedge.


Oil Market

The Oil Market is set to bounce in the coming days. Expect this technical reaction of the recent sell off to generate weakness in the market. Look at the chart below and you will see that every major bottom is accompanied with the -DI crossing below the -ADX line in the 40 area.

Oil%20100206.png


XAU

The XAU gave back a lot of its gains today. The 119-121 area appears to be holding quite well. Like the Oil Market, the golds are putting in a bottom and should shortly began to experience a technical bounce. Expect the XAU to fill one or more of the gaps in the 140 area.

XAU%20100206.png
 
New all time highs reached, not a lot of wavers were predicting that. So far my count has been correct. After examining the short term charts I feel the uptrend still has more to go after an impending sell off. A short term down wave followed by another short term upwave to another all time high looks on the cards. Then it will be a nice ride down to the Oct 2004 lows.
 

Attachments

  • f.png
    f.png
    18.3 KB · Views: 279
A drop is imminent but it may be just a breather before one more push up which as usual will confuse everbody. I certainly would not be long as I believe the next big move is down to the Oct 2004 lows but I am not over indulging on the short side just yet. Plenty of time for that once the down move is in motion. What I am looking forward too is the end of the next big move down into the Oct 2004 lows (although that down move should be enjoyable) as after that I have it on all counts that there will be a big, big up move way above the highs we are seeing now. That will be some ride !!!
 
Last edited:
The futures are pointing to a lower open for the DOW.

Will be interesting to see if this is the start of a substantial fall, or just a breather for the recent rally.


Thanks


Damian
 
newschoolwaver said:
New all time highs reached, not a lot of wavers were predicting that. So far my count has been correct. After examining the short term charts I feel the uptrend still has more to go after an impending sell off. A short term down wave followed by another short term upwave to another all time high looks on the cards. Then it will be a nice ride down to the Oct 2004 lows.

If you look back to the rally from October 1999 through January 2000, it closely resembles the technical formation of the markets today. There was a pseduo double bottom that preceded a relentless wedge type formation that just kept going higher, then there was a knee jerk correction, and then new all-time highs. I am in the camp that we will experience a fifth wave failure and unlike 1999, once we approach the 11,900 - 12,000 area that will be it. Only time will tell, but either way we are within 100-150 points of some sort of top.
 
Dow Jones predictions

Hi,

I have been reading all about the Dow on your website and the post. It looks good what you are saying but how can you do so sure that the Dow will do what you think it will?
I mean i can see you use the charts and i sense you are only trading futures but still isn`t it dangerous to look so far in future and predict with such a certainty what will happen. So far you were far that the Dow reached 10700 mark and now it is going down little by little every day but how it will reach 10000?

Waiting for your comments.

Take care and happy trading!


oldschoolwaver said:
Monday, July 24th 2006

Short Term Trend - Bullish 11700-11750

Long Term Trend - Bearish 9800 - 10000

Dow - Short Term Outlook

Well in Friday's update I stated that we would either go after the support line at 10800 or attack the resistance line in the 11,150 area. As you can see from today's action we chose the latter. Today we were able to close above the highs of last week's rally, which is critical for the bullish case. The next area of resistance is the high of 11,257.08. The volume was light today, which tells me that this bull run will more than likely be on light "summer volume". This lack of volume is going to be our major clue that the bear is right around the corner, hence the sub 10000 low coming in October.

For now, just sit tight and expect more follow through for the short term. Once we clear the blue resistance line below, expect the rally to get underway with earnest.

Dow_7_24_06.png


Dow - Long Term Outlook

The Dow is currently setting up a violent double bottom. Odds are we will make a minor penetration through the 10698 low (Actually occurred on Tuesday 7/18). Once we put this low in place, expect the Dow to make a new high for '06. This high will be in the 11,700 - 11,750 range. This high will be reached as early as August 14th and no later than September 1st. Once we reach this target area, the Dow will begin it's 8-year cycle low descent. This sell off will take us down to the sub 10,000 level. Expect the '04 low of 9,708.4 to be tested. This low will come on October 12th. Once this low is in place, the Dow will be ready to begin another multi-year impulsive move up that will take the Industrials to 12,000 and beyond.

Visit my site for more free analysis.
 
makarona said:
Hi,

I have been reading all about the Dow on your website and the post. It looks good what you are saying but how can you do so sure that the Dow will do what you think it will?
I mean i can see you use the charts and i sense you are only trading futures but still isn`t it dangerous to look so far in future and predict with such a certainty what will happen. So far you were far that the Dow reached 10700 mark and now it is going down little by little every day but how it will reach 10000?

Waiting for your comments.

Take care and happy trading!

Makarona - no one knows for sure what the market will do over the long term. The best chance you have at making money is following the technicals and using the past as a guide for future events. Yesterday the Dow hit the uptrend channel I have been talking about for a few weeks now. We will all know in the next few days if my analysis is sound, when there is a serious reaction off this line. However, I am a trader and I have no bias to either the long or short side and if it blows the line out, I will be waiting on some sort of reaction to get long. The good news is volatility is back in the market, which is a requirement for anyone to make money. Stay tuned as it's sure to be a wild one, either way it goes.

Good Luck Trading
 
reply

hi oldschoolwaver,

Thanks for your reply. Of course what you said is completely true and real. I use the same strategy but lately didn`t have time to do proper research and you helped me in this with your detailed technical research for which i have to be very thankful.
The volatility is back and i like it as well. As my strategy is to trade only a few hours per day and mainly before the market close i think it is a way to make a little bit of money.
You will hear from me again:)

Keep up the good work and thanks once again. :)

Happy trading!


oldschoolwaver said:
Makarona - no one knows for sure what the market will do over the long term. The best chance you have at making money is following the technicals and using the past as a guide for future events. Yesterday the Dow hit the uptrend channel I have been talking about for a few weeks now. We will all know in the next few days if my analysis is sound, when there is a serious reaction off this line. However, I am a trader and I have no bias to either the long or short side and if it blows the line out, I will be waiting on some sort of reaction to get long. The good news is volatility is back in the market, which is a requirement for anyone to make money. Stay tuned as it's sure to be a wild one, either way it goes.

Good Luck Trading
 
Top