Dow Jones Day timing

Peter

Active member
Messages
153
Likes
0
Day traders may find this link useful for timing entries when scalping OR sometimes Main pivots shown with ****

http://groups.yahoo.com/group/ganncycles2004/


10240 held after all on Monday which had been my initial support prior to 10300. Surprisingly 10100 also found support which NOW makes me question what next as both initial resistance and support were met on the same day.

I do wonder if 10100 / 10070 could hold the market and prevent an early hit of the vital 10,000 level Im sure many are expecting.
If the market remains lower on tuedays open, I would expect 10,000 to have support.

Ill be watching to see if around 15.37 hrs ( 10.37 EST) we get a reaction. Maybe find a low..

Depending on first hour Tuesday, If we can hold 10100 to 10,000 Id like to see market rally uptowards Fed meeting at 19.15 hrs ( 14.15 EST)

If we do rally and break 10240, id expect to test 10300.10320ish.


14.37
14.43 ???
14.49 low

15.08
15.18*******
15.23/30
15.37 *********************
15.54/58

16.21/
16.28/30
16.44/55

17.06
17.28
17.41/48* ??? or 18.48

18.18
18.23/26
18.40***********
18.54

19.14/17/19********
19.32/37
19.48/55********

20.26/31*****
20.58
20.53
 
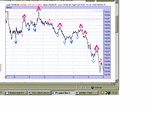
The chart shows the Dows action for today

The Thick RED ^ indicate some of the MAIN ***** pivots that I indicated. The thinner ^ indicate some of the other times I mentioned.

The THICK Blue V indicate the Main LOW pivots of the day, and the thinner V show other times mentioned.

The times from 18.40 throught the fed announcement at 19.14 / 19/17 / 19.19 hrs worked almost exactly to the times.

Then the Low around 19.48 indicated by ***** found a nice rally last hour.. The 20.30hr found a 2nd minor low and pushed up even further.

overall worked quiet well today..

Yesterdays action is also posted ON

http://groups.yahoo.com/group/ganncycles2004

Main pivots shown with ****


10240 held after all on Monday which had been my initial support prior to 10300. Surprisingly 10100 also found support which NOW makes me question what next as both initial resistance and support were met on the same day.

I do wonder if 10100 / 10070 could hold the market and prevent an early hit of the vital 10,000 level Im sure many are expecting.
If the market remains lower on tuedays open, I would expect 10,000 to have support.

Ill be watching to see if around 15.37 hrs ( 10.37 EST) we get a reaction. Maybe find a low..

Depending on first hour Tuesday, If we can hold 10100 to 10,000 Id like to see market rally uptowards Fed meeting at 19.15 hrs ( 14.15 EST)

If we do rally and break 10240, id expect to test 10300.10320ish.


14.37
14.43 ???
14.49 low

15.08
15.18*******
15.23/30
15.37 *********************
15.54/58

16.21/
16.28/30
16.44/55

17.06
17.28
17.41/48* ??? or 18.48

18.18
18.23/26
18.40***********
18.54

19.14/17/19********
19.32/37
19.48/55********

20.26/31*****
20.58
20.53 [/B][/QUOTE]
 

Attachments

  • aaa..dow jones.... mar 16th  2004.gif  .gif
    aaa..dow jones.... mar 16th 2004.gif .gif
    20.3 KB · Views: 810
Dow Mar 18th..http://groups.yahoo.com/group/ganncycles2004/

Further posts or updates on http://groups.yahoo.com/group/ganncycles2004/


After the Fed meeting on Tuesday and the initial decline, once again 10100 held as vital support preventing any decline to 10,000.
I was pleased that I did have a good time signal in around 19.48 ( 14.48 EST ) that did help me avoid holding heavily short..
That resulted in a 230 point rally which also managed to hit the 10300 area I did want to see. Unfortunately for bears , yesterday on reaching an early signal I had in mind, it turned out a further buy signal and held the market higher , rather than reverse it back down.10300 slightly broke and held at the close.


What from here..

I still think that today has a chance of reversing as long as 10330 / 360 can hold. IF we break 10360 ( This is the 38.2% retrace of the 10750 - 10090 range ) then I would still wonder if 10420 / 450 could hold being the 50% retrace, BUT here It will be unlikely any big low will be made by close of Friday.

I still suspect the 24th March to be a low for this leg down, and do think a break of 10090 could see possibly 9600 to 9000..

If however we break 10450 , I would be much less inclined to suspect this could occur.

we need to break below 10240 which may offer support on any attempted sell off.

The Chart I posted late yesterday on the spx, shows some good trendlines I believe has a good chance of suggesting the markets highs yesterday are at Make or break for this rally.

19.50 hrs ( 14.50 hrs EST ) looks very interesting !!! Id hope that the ***** signals can ofer the main pivots.

Times shown are GMT ( minus 5 hrs for EST)

5.26
6.50
8.45
9.34
10.29
11.47
12.06

14.34
14.53*** L
14.58

1510*******
15.19
15.26
15.39****
15.48??

16.04*****
16.16
16.30********
16.37*****

17.00/17.08
17.26/30
17.38/44******
17.54/58

18.18**
18.26/30******
18.50

19.02/08*****
19.50**********************

20.00/08*************
20.14***
20.23***
20.36
20.46*******
20.59
 
Re: Dow Mar 18th..http://groups.yahoo.com/group/ganncycles2004/

Updates on http://groups.yahoo.com/group/ganncycles2004/

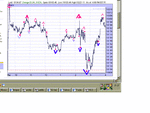
Yesterday 10325 managed to hold and some of the times worked remarkably well later from the low we had at 10215 ish and the spike high that followed. Then the 19.50 hrs (14.50 hrs EST ) still held the market up.

The news of the Al qaeda events may well be part of it. Otherwise Some reasons behind the index option straddle expirys as I am led to believe.

What for today..

Again 10325 is the top target, The overnight session has held up, SO the last signals I had were bullish. Remains to be seen if 10325 breaks with a hourly higher swing low formed above to give signs of strength.

Otherwise there MAY be selling leading to other futures options expiry.

Last few days have been highly frustrating for short term bears.

The cycle Pattern I was watching from 87 hasnt continued to plan over last two days which MAY spoil my expectations for a low on the 24th especially if we hold up above 10320 today.

Times shown GMT for EST minus 5 hours...


1.45************
12.49

14.30
14.47****

15.07***
15.33
15.47
15.57

16.02*****
16.24
16.42/47***

17.02/05*****
17.20***
17.28
17.58

18.02/08*****
18.18
18.27
18.54*****

19.18***
19.31***
19.38************or 20.18
19.49*********

20.00
20.08
20.18*********
20.30****
20.40
20.51***
 
Hi Peter,

Joined your Yahoo group, I went over some of your more recent updates and found them quite interesting.
I can see at or around the time indicated there is a movement in the opposite direction giving some gains. I believe that the icing on the cake is to determine which direction to go. What do u use stochs div trend lines ?

How long have you been using GANN?
How succesful have you been ?
I always felt it was akin to black magic and too wooly to be of any value. But as you post the times well before market openings they seem to give good pivots within 5-8 mins. So must be something in it.
Can u recommend any straightforward reading software etc., that may be of value to me at my uninitiated stage ?

I look forward to following your posts.


Richard
 
Hi Richard,

Hope that you find the times useful..

I have been aware of Gann for about 8 to 9 years, and by no means do I claim to be an expert..

I do howver find Certain techniques I have been taught do work well in terms of analysis, BUT trading and analysing are two different things.. I could analyse 95% of things right, but still fail to get the rewards when trading..

This concept of intraday times is relatively new, and isnt something I have a full track record of as such yet.

The timing cycles however have overall worked very well.. which I am pleased with. I used these times to pin point the recent decline from Feb 19th and again on Mar 8th prior to this 500 point fall. I also came out at 10100 after the decline and reentered at 10320.

Many of the times do work within 5 mins, and some to the minute.

Today and yesterday found the days tops or 2nd tops to the minute almost.

You probably refer to Gans astrology as the black magic, BUT I dont use astro to work out my timing.

I do use a combination of Ganns cycles methods, Fibanacci, time retracements, Gann numbers and a few other things Ive discovered.

At the end of the day you have to judge for yourself if you think the times can be useful after following them for a while.

I NO LONGER use software, I could recommend a few , BUT its a personnal choice. IM sure you will find much alreaDY MENTIONED on various groups inc T2W. Bryce Gilmores is one that comes to mind, as well as Ganntrader 3 that I do think are good, BUT they are expensive.

I do use a combination of other TA including trendlines, price retracements, and swing trading.. I dont use a great deal of more complex TA such as stocastics in great detail, BUT I have other sources who often can back that sort of TA up for me.

My advice is if you decide to folow and make use of the times is to find what other TA you personally find OK to use a s a back up.

I just post the times which often will be an indication when moves are likely to take place. IM NOT saying its always easy to determine direction.

Sometimes the times will be a change in trend, OTHER times they will be say a lower swing top or further good lows or high entry points if for eg one misses the top of the day, hopefully the times can help you get in at a 2nd best entry time.

I also USe bigger cycles which I DO often inform members when I believe its a MAIN pivot day.

After today Im still expecting a low to the 24th. Fortunately 10320 held and we managed to sell off.

Hope this helps

Pete


triplepack said:
Hi Peter,

Joined your Yahoo group, I went over some of your more recent updates and found them quite interesting.
I can see at or around the time indicated there is a movement in the opposite direction giving some gains. I believe that the icing on the cake is to determine which direction to go. What do u use stochs div trend lines ?

How long have you been using GANN?
How succesful have you been ?
I always felt it was akin to black magic and too wooly to be of any value. But as you post the times well before market openings they seem to give good pivots within 5-8 mins. So must be something in it.
Can u recommend any straightforward reading software etc., that may be of value to me at my uninitiated stage ?

I look forward to following your posts.


Richard
 

Attachments

  • aaa...dow 1 day  chart.bmp  times mar 19th.gif
    aaa...dow 1 day chart.bmp times mar 19th.gif
    19.2 KB · Views: 660
I expect the Sunday night / monday morning to open with direction from 1am..

If we are going to find a low by the 24th we need to break 10090 low made on the 15th.
if the 10100 to 10300 range hasnt been broke first half of day, id expect 19.00hr may offer direction for a move to break this range for the week.

Otherwise I suspect if we break 10325 on monday , I expect we will see a rally into April.

Two dates I have in April are 2nd to 5th and 16th to 19th..

For future Further daily updates at http://groups.yahoo.com/group/ganncycles2004/


Times shown are GMT.. For EST minus 5 hours.

1.00******************

6.05
8.04
9.10
10.13
10.49

14.48
14.50/53********
14.58

15.17
15.47**********

16.00****
16.08
16.17/23**********
16.53

17.00********
17.23/26***
17.48
17.54***


18.11/17***
18.26/30*******
18.36
18.47/54*****

19.02/08********************************
19.30
19.43/53

20.10/16******************
20.26/34******
20.49
20.58
 
Got immediate decline from the Sunday night / Monday early open I expected.

BROKE out of the 10300/10100 range

HIT near to 10,000

And found a low at 14.08 EST .. 19.08 GMT as indicated....

Overall worked very well today !!!
 
Evening Peter,
Just had a look at the times .There seemed to be a correlation of turning points and the times again.
The low was picked but not with an ***** indicated time.17.38 for the 17.39 bottom.

The 18.36 time was intersting as it was in a channelof congestiongoing nowhere. On the stochs and rsi there wasnt a hint of which way to go but it did move and the next time target of 18.47-1854 did yield a fair sized point count.

I know this kind of ta can be seen as a scattergun approach across the time scale of the day but, I must admit that they can be used as a compliment to other TA to act as an additional alert
signal.
I tried to have a look into GANN and there seems to be a few traders (on elitetrading.com) who do follow it and use it quite succesfully as a compliment or standalone. They tend to be the quieter members whilst the louder ones slag it off.
Myself I cant see the prices for the lines LOL.
The only Ta I've been able to find to predict the future is hidden divergence and this is for price not time. When I found that, it blew my mind on how often an acurately it worked , but as always, when you come to use it bang it doesnt.

Look forward to tomorrows posting cheers

Richard
 
Hello Richard,

I dont think theres a man alive who could give **** on times for all main turns in the market.

Today we didnt get the low BUT the 18.36 was were the move started .. Its not possible to know if it will be the high or low of a swing or the start of the move. There was 50 points on offer from that.

Many day traders are delighted with 20 to 30 points in a day.

If you expect that kind of consistency, I think you will be amazingly fortunate to find such a person.

Overall this week however many have worked very well.

the late signals today worked well for the final hour decline.

Big day tommorrow. !!! I expect a good move and a potential reversal. Ive been indicating the 24th for some weeks now.


triplepack said:
Evening Peter,
Just had a look at the times .There seemed to be a correlation of turning points and the times again.
The low was picked but not with an ***** indicated time.17.38 for the 17.39 bottom.

The 18.36 time was intersting as it was in a channelof congestiongoing nowhere. On the stochs and rsi there wasnt a hint of which way to go but it did move and the next time target of 18.47-1854 did yield a fair sized point count.

I know this kind of ta can be seen as a scattergun approach across the time scale of the day but, I must admit that they can be used as a compliment to other TA to act as an additional alert
signal.
I tried to have a look into GANN and there seems to be a few traders (on elitetrading.com) who do follow it and use it quite succesfully as a compliment or standalone. They tend to be the quieter members whilst the louder ones slag it off.
Myself I cant see the prices for the lines LOL.
The only Ta I've been able to find to predict the future is hidden divergence and this is for price not time. When I found that, it blew my mind on how often an acurately it worked , but as always, when you come to use it bang it doesnt.

Look forward to tomorrows posting cheers

Richard
 
Hi Peter,

Yes the 1836 time was a good 'un, but what I meant was, that the 17;38 wasn't a time with the significance attached to it, but it DID deliver those points and was significant. And the following times were good indications of when to look to get ready to get in/out.

Keep up the interesting work I'm following you.

Richard
 
What you have to remember is the times I post are ONLY a GUIDE.. THEY ARE NOT GOSPAL... I do state this on my group.

I suggest each individual to back them up with their own EXTRA TA..

SOME WILL WORK WELL just on times alone.

Also remember its only ME that attempts to put a **** against what I think well be the better times.. I like anyone can make errors and its only down to my judgement..

Other times can still offer good moves OR secondary good entry points.

Sometimes you will get a good top or bottom form, and one of my times MAY come in just after say 5 mins later as a 2nd higher or lower swing.. THESE times can still be great times to enter a market.

ADMITTEDLY .. Its exceptionaly difficult on certain times to say if it is going to be a 2nd entry point OR another change of direction.

Often you will find for example times come in as a series of lower tops or higher lows. I advise you to read up on swing charts to find out more what I am trying to explain.

Swings can be applied to various time frames. Daily, hourly or 5 minute bars...

I also made suggestions of price levels. Todays highs on the SPX managed to hold below the lows made last week.

I often use the spx or Dow past support or resistance as guides where to expect market may have problems breaking.

In this example as the Dow had already tested its lows last week, I realised the SPX hadnt.

This proved almost right today as IT didnt hit last weeks lows, BUT held below it on the attempted rally.

You need to try and get an understanding of other things to apply with the times as well, as this will help.

I want to see what the overnight and first hour does tomorrow.
This should help determine the direction my main time signal by 16.00 hrs works for rest of this week or so.

exact time will be posted on Ganncycles.

This signal should be worth £1000s if it works to plan.
 
ALSO remember when I quote days of MAIN changes in trend. with certain times in mind , I try to give entry points with limited risk and tight stops.., I attempt to give signals for position trading as well as day trades.

If this works tomorrow, I have two dates in mind for April, so we hold at least a week / 10 days for the next time target.

Other date in mind is mid April if market manages to stay up on a rally for example after the 5th April.

inverse if we continue down for rest of this week.
 
The Low on the Mar 24th has seen a nice 343 point rally so far.

If we break 10380 ( 50% retrace of last 743 point range, I suspect the market may find resistance at 10420 to 10440. Above here 10500.


Ive presently got a few PC problems which has prevented me giving the normal intraday timings.. Also two of my email addresses have been full.. I know some members have emailed ..

Its probably better if you email me at [email protected]

Ive Just done some manual timing calculations,..

If the Dow tops between 17.00 and 18.30 hrs GMT ( 11 and 12.30 EST )

Market should see a fair sell off. If we have a low should be further buy signal.

more details on

http://groups.yahoo.com/group/ganncycles2004/

I Will try and post more specific time nearer the time.

If we break 10500 this next two days I think theres a chance we will retest 10750 and quiet possibly top around April 16th.
 
Peter said:
If the Dow tops between 17.00 and 18.30 hrs GMT ( 11 and 12.30 EST )

Peter, a very specific post. Can I just be clear when you say GMT you mean GMT (as we're now on BST)?
 
Well, that was interesting Peter.

It just touched 10380, so technically didn't break it I guess.

Your prognosis was based on what it might do if it did. Did you have a game plan for what it might do if it didn't (or as was the case), just touched the 50% retracement level?

Your call on the High or lOw at 11:00 - 12:30 proved correct. Or did you mean it would indicate a longer-term (rather than intraday) buy if that period was a low.

As if I didn't have enough trouble concentrating on too many things at the moment, this has re-kindled my interest in Gann.
 
Hi Bramble,

Sorry for delay, As I mentioned my email addresses have ben full. so I didnt see any email to your reply. This is first time ive looked at T2W since last post.

10380 was hit for a while and the market did decline to 10315, however Its Now hit 10420 which was my next target I indicated.

Friday could be important if the market tops into my timeframe and is at a price level I like.

I would say one plan worth considering is to take say two contracts IF a price and time point is hit which I suspect are more impotant levels, Then look to play one as a position trade with tight stop if possible, and play the other contract to say look to day trade. If you hit a target you are happy with , say 30 to 50 points on the day trade position, then take profits. mean while hold the position trade ( and Ideally move stop so NO or little risk is most likely) IF them the market went in your favour you are still in the trade. IF it then turns back, you will be stopped out. Hopefully for little or no loss..

Then later look for the next best entry and apply the same rules.


Otherwise one could try and scalp some of the other times ( ideally on lower stakes if spead betting )

Ive posted my next analysis for friday 2nd April.


Pete


TheBramble said:
Well, that was interesting Peter.

It just touched 10380, so technically didn't break it I guess.

Your prognosis was based on what it might do if it did. Did you have a game plan for what it might do if it didn't (or as was the case), just touched the 50% retracement level?

Your call on the High or lOw at 11:00 - 12:30 proved correct. Or did you mean it would indicate a longer-term (rather than intraday) buy if that period was a low.

As if I didn't have enough trouble concentrating on too many things at the moment, this has re-kindled my interest in Gann.
 
The Dow did top out on April 1st at 10420 which I had indicated was
my next target if 10380 broke ( 50% of the last 745 point range) .
That top also did come in also at the time I indicated yesterday.

For today I await to see if we make a new top for this week and to
see if the Dow breaks 10420.

April 2nd is the next time cycle I had in mind since the low on the
Mar 24th.

I think if the market does break thursdays top, it has a good chance
of hitting 10520 which is my next price level if the 10420/440 range
should break.

10468 is the 61.8% retrace of the last range,
10446 is a 138.2 % extension of the last smaller 10325 - 10007 range

but I think the 66.6% retrace looks the better target at 10504
closer to my 10520 which is a 161.8% extension of the 10325 - 10007
range.

There is Important economic data realeased on Friday, both prior to
the main cash market opening and later .

8.30 EST and 12.00hrs EST. (The data times below are GMT)
..
18:00 Core PPI Feb 0.1%
18:00 PPI Feb 0.4%
14:30 Average Workweek 33.8
14:30 Hourly Earnings 0.2%
14:30 Nonfarm Payrolls Mar 100K
14:30 Unemployment Rate Mar 5.6%


The Initial time that I am concerned with for Friday is about 16.00
hrs GMT ( 10.00 EST )


Ive attempted to work out the times for today in more detail.

The times below are GMT.. ( for EST this week Minus 6 hours )

The times with ***** against them are what I believe will be the more
important times within each hour.

13.48
13.53****

14.29
14.39********
14.47???


15.00*****
15.16**********
15.25???
15.49
15.54/59*****************

16.05
16.26/31*****
16.40
16.47
16.56******

17.01
17.07/09****
17.24****
17.31
17.42/47******

18.02
18.38****
18.54

19.02***
19.18
19.28/30****
19.39/41*****
19.51**********

20.02/08******
20.20
20.34/37

21.17
21.39/42*****
21.49


Message below was sent on Mar 31st

The dows / spx just hit the 50% retrace of its last 745 point range between Feb 19th and Mar 24th.

It will be interesting to see if the indexes turn down from here.. If we break tuesdays high, I suspect the dow will hit 10420/10440.

If the market holds up I think we will see a top for April 2nd / 5th, otherwise a sell off I think could see a next LOW ( probably a higher swing low above 10007.

The message below I wrote on the 24th has worked very well.. You may find the timing useful.

http://finance.groups.yahoo.com/group/ganncycles2004/message/49

http://finance.groups.yahoo.com/group/ganncycles2004/


I mentioned on at least two main dates / occasions that I was looking
for a potential low on the 24th March since the top on Feb 19th.

I have a MAIN signal in first hour today at 15.30 hrs ( 10.30 EST)

If we find a low I would expect a great buying opportunity, IF its a
top a further main selling oppotunity..

If we Turn up next date for a top April 2nd to 5th.. Or if we go
lower expect fall to at least this date.
 
Top