DOW Intraday

ChartMan

Legendary member
Messages
5,580
Likes
47
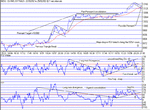
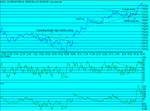
Lots to see today on the 1 min chart. Starting this week, the Intraday charts will be kept in a weekly thread for continuity.
Another example or Resistace/Support swap can be seen, and unconfirmed Negative Divergent top. Note the eventual breakout shortly after the trend switch from resistance to support and the longer term higher lows just before the intesection of the trend reversal on RSI.
 

Attachments

  • 02_02_25.gif
    02_02_25.gif
    18.6 KB · Views: 438
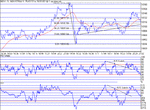
Yesterday's closing pennant did go, just....Points of interest today- Fib performance/fitting. Yet another break on Resistance /Support trend line swap for the library.
 

Attachments

  • 02_02_26.gif
    02_02_26.gif
    17.8 KB · Views: 387
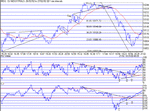
Note triangle = sided as opposed to "flat top" and the RS switch in the support line of the triangle, signalling down.Good Fib fit from the low at 10,037 to 10,255.Good fit on all points all the way down Pity it didnt make a perfect drop to the zero point.
 

Attachments

  • 02_02_27.gif
    02_02_27.gif
    18.2 KB · Views: 364
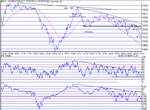
H&S top. "W" bottom. 4 changes in slope.Horizontal support, changing to resistance at the uptrend failure . Note the bear wedge forming on RSI and CCI.
 

Attachments

  • 02_02_28.gif
    02_02_28.gif
    17.4 KB · Views: 389
Expanding triangle. Bull Flag,Triangle break.
 

Attachments

  • 01_03_02.gif
    01_03_02.gif
    17.8 KB · Views: 345
Top