Let's take a look at a 2 min chart, so we can see the channel situation. Looks good sofar for being just a pullback. Some reasonable divergence showing a short term bottom at least... But for confirmation we would need to see a break of 9320 and , preferably, a retest of that level. The pullback has touched the 38 % retrace line from 9487 to 9000. The "W" bottom has a target of 9360. That would be broadly in line with a new channel resistance drawn parallel to the recent uptrend resistance line. Remember these lines run like tramlines - parallel.
You are using an out of date browser. It may not display this or other websites correctly.
You should upgrade or use an alternative browser.
You should upgrade or use an alternative browser.
Not a bad day considering some were saying thin volume... It didn't seem thin to me... The lack of any big moves meant a good chance of being whipsawed...but getting in on a short early in the session and sticking with it would have been a good choice, with a 20 point max deviation being the most seen to be against you.The out was the tripple bottom/PD at 17:16, with a miserly target of just 20 points on the break- but that did give up a bit more from T1, by another 8 or so. But then what? RSI looked very weak, dropping 60 for a 16 point price drop.But the rise to 9308 was equally weak RSI 34 for an 8 point move up...Not an easy call and easy to hold onto the gains, only to see them evaporate in the hopes of more upside. I guess the fianl decision would have been the loss of 9300...Any other ideas?
The second target of t2 failed because of time. Will the rise continue tomorrow? Who knows, but we doo have clear cut long short entries- 9320 and 9280 ish
The second target of t2 failed because of time. Will the rise continue tomorrow? Who knows, but we doo have clear cut long short entries- 9320 and 9280 ish
Attachments
CM, does that not look like a bear flag on the 15min & 60min charts?
Was trading from home yesterday - the less said about that the better - got trigger happy and reckless with my stake - broke all the rules and consequently got whipsawed like crazy 🙁
Ah well, back to square one.
Was trading from home yesterday - the less said about that the better - got trigger happy and reckless with my stake - broke all the rules and consequently got whipsawed like crazy 🙁
Ah well, back to square one.
Doesn't look like a bear flag now.... So that's that cleared up. I'm not poking fun, it could have developed into a bear flag, it just didn't look like it to me.... but then the closing half hour cannot be relied upon to form TA decisions, especially across the day's boundary.Except just very occasionally...On the other hand, it did tank, so yes, it was a bear flag.But then again, it didn't develop across 3 cycles.
All that just goes to show that no matter how hard you interpret the charts, you stand on your own and others will always have an honest different opinion. Each will be convinced their opinion is the correct one. Just don't let your opinion fool you into holding onto a trade just because it's going against YOUR opinion. even more important, don't hold onto it because it's going against MY ( or anyone else's) opinion.
So what have we here? A bigger drop than I expected, in fact I expected none. Another day of PD, showing that you can't call PD's on 10 min chart to any accuracy. Inv. H&S now formed with a target of 9380, T1. You can see that 9340 is very important. It forms both a channel down resistance from the top and a support line parallel to the old uptrend support line. These parallel tram lines are very important in giving clues as to where the price is headed. See how the top at 9481 on 21/08 open formed a downtrend resistance line? At the time we had no idea of the future action, bar guessing. See how the tramlines all line up symetrically? It's more than a coincidence. It's a frequent occurrence. Plan your support and resistances from here.....Channel widths tend to be equi- distant too.It defines how far up and down the market will stand. With no major reason for a change, it should be stable from day to day. So from that and the many uptrend lines I have drawn I can see which pair resembles the closest to the recent channel widths. In this case it's the bottom one and the third one up...... So will that define our new channel? Time will tell.
Attachments
Strange day... Failed W to start with giving a good short entry for the brave, so close to the open. Taking it as a bear flag ( discussed above) there is NO target. The first target came from the small pullback at mid 9264. This clearly failed by a long way, signaling a short cover.
Now a long wait for the next entry, but which way? Nothing for 3 hours what a bore! The break of res at 18:36 was the cue, breaking both 100MA and res at the same time and a decent lift in volume on ES to confirm.... Safe entry at either of the two pullbacks toward the 100MA as shown.That bo gave T1 , duly met , but with a pullback soon after.18 points, tricky call ... close or hold? Easy, well given you need to have a 20 point margin for breathing, the price bounced right off the 10 min res tramline. How nice. Great comforter.That pullback gave us T2. The pullback at 9300 ( tiny) gave 9330 as the next target... No easy out , no ND top but 3 or 4 tries at 945 must have sunk in sooner or later... 🙂 So 50 short and 100 long was on the table..
Now a long wait for the next entry, but which way? Nothing for 3 hours what a bore! The break of res at 18:36 was the cue, breaking both 100MA and res at the same time and a decent lift in volume on ES to confirm.... Safe entry at either of the two pullbacks toward the 100MA as shown.That bo gave T1 , duly met , but with a pullback soon after.18 points, tricky call ... close or hold? Easy, well given you need to have a 20 point margin for breathing, the price bounced right off the 10 min res tramline. How nice. Great comforter.That pullback gave us T2. The pullback at 9300 ( tiny) gave 9330 as the next target... No easy out , no ND top but 3 or 4 tries at 945 must have sunk in sooner or later... 🙂 So 50 short and 100 long was on the table..
Attachments
china white
Established member
- Messages
- 979
- Likes
- 12
CM,
perfect spotting of the reversal point! 2 b quite honest I completely overlooked CCI breaking res, and based my long entry on Dow re-testing the earlier low of the day and holding above it, Spooz still sitting comfortably above its earlier low, 100 MA crossing + a bit hairy but RS switch on RSI S&P cash (not perfectly chiseled but still giving a clue). Of coz CCI break just seals it.
After that it was just a matter of increasing the position at pullback breakouts. Finished the day running 4X normal long exposure. Great day indeed!
CM, a quickie - today 4 the 1st time I followed ADX trend-tracker. On 5 and 10 min I found it 2 b quite tricky 2 read, however, on 1 min it nicely confirmed the rally and, even more importantly, stopped me from closing my 2X longs at what seemed 2 b a double top @ about 9290 cash. Do u use ADX and if so, what r yr thots on it?
cheers
Beginning to think that in this low volume mkt, long term TA (ie as opposed to intraday TA) such as flags don't seem to mean much. Only relevant TA seems to be channel line, support & resistance.
One thing that's been bothering me is target failure - I did go short on the pullback and got out when the target failed - but only after much wringing of hands 🙂 Have never been sure about what to do when target fails. After I'd covered, I kept on thinking I should have stayed in 'cos the price stayed below 100MA - was very tempted to go short again - glad I didn't.
CM, is covering a long or short on target failure usually the correct thing to do - or do other factors have to be taken into consideration too?
Also, any particular reason not to go short again when price stayed below 100MA and trend was down? I'm thinking in particular of other days when the price has behaved in a similar manner and stayed below 100MA all day. Or would the short cover at the beginning served as a warning?
Thx.
PS - and I was feeling so please with my bear flag theory 🙂
Never made it. Now we're going sideways and so we need to look at horizontal support as our main levels. Support followed 10min uptrend support, meeting at 9320 or so.Horrible day to trade whith a high probability of taking multiple losses.... It needs a breakout, not too difficult to plan longs and shorts- 9350- 9320
Attachments

I would, but there's not too much peak to trough touching going on + take away yesterday's last gasp action and make it flatter nad we get a more sideways looking affair. Either way, the support resistance break is the same, but with the triangle giving you an idea of a target, which will help the decision making. I'll go with the triangle. :cheesy:
nice one rosso - did u go short on that basis or the dbl top or both?
I've kinda become distrustful of long term ND/PD - anybody know how often it pays off.
Must admit, I had my mind set on an upside break 'cos it looked like an ascending triangle to me - was waiting for it to break 9360 and got caught on the drop and didn't take advantage.
I've kinda become distrustful of long term ND/PD - anybody know how often it pays off.
Must admit, I had my mind set on an upside break 'cos it looked like an ascending triangle to me - was waiting for it to break 9360 and got caught on the drop and didn't take advantage.
Longer term divergences I find very hard to predict their outcome with any degree of accuracy. Tops have their own characteristics and so I've ignored ND's , bottoms just seem to drag on for ages and then bang.
A brave short entry early on from yet another opening double top would have paid a nice divvy of 60 + points. Then a long entry after the sideways action around 9280 and a hold right into the close for 80 +. Note the confirmation bounce coinciding with yesterdays horizontal resistance at 9340.
A brave short entry early on from yet another opening double top would have paid a nice divvy of 60 + points. Then a long entry after the sideways action around 9280 and a hold right into the close for 80 +. Note the confirmation bounce coinciding with yesterdays horizontal resistance at 9340.
Attachments
rossored
Senior member
- Messages
- 2,103
- Likes
- 56
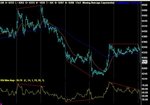
Here's the last 11 days of YM, with 5 solid cases of PD / ND marked off - excuse the size of the chart, please - including yesterdays high, which showed ND and sure enough has reversed off the high back down to 9359 this morning, as shown.
CM, what do you mean you find it hard to predict their outcome exactly? I was on the understanding that the longer a pattern takes to develop the more reliable it is, so 10min divergences should be more reliable than, say, 1 min divergences. I'm not criticising, just interested to have you view on it - in fact, if it hadnt been for your views, I'd probably never have gotten into it as much as I have! 😆
CM, what do you mean you find it hard to predict their outcome exactly? I was on the understanding that the longer a pattern takes to develop the more reliable it is, so 10min divergences should be more reliable than, say, 1 min divergences. I'm not criticising, just interested to have you view on it - in fact, if it hadnt been for your views, I'd probably never have gotten into it as much as I have! 😆