You are using an out of date browser. It may not display this or other websites correctly.
You should upgrade or use an alternative browser.
You should upgrade or use an alternative browser.
An interesting day of trading for a novice like myself!
I have a few questions, I have ordered Murphy's TA book from Amazon but haven't received it yet so am still struggling to grasp what the RSI and CCI mean in reelation to the price. I would appreciate any comments to help me out 🙂
1. In Chart3 attached (sorry this is backwards, I am not used to attaching files on here) I identified the triangle indicated starting at about 14:45. I am correct that your target should be the height of the mouth of the triangle, from the point where the triangle is broken?
2. Chart 2, another triangle but this time the price dropped a lot more than I expected. Should I have looked back further for a continuation of the triangle or were there other factors that I didn't notice?
3. Chart 1. Getting close to 7pm and a third triangle forming. I guessed the mouth of the triangle was about 50 points in height and went long at 080 when the triangle was broken. I assumed my target was 120. I bottled out at point X and collected 30 points so was happy, even though it did climb higher. Still not sure if it was possible to see that it would go higher still or if I did the right thing?
I then saw a clear head and shoulders at 19:29 - 20:07 and went short at 102 collecting 10 points. Was hoping it would drop to the "magic" 064 but was happy to collect another 10 points. Don't know if I was just lucky or if anyone else expected it to drop further?
Kind regards,
Justyn.
I missed this so I'll append it here.Yes you're right on point one. On point two, one never really knows just how far a move will go at the outset. Sometimes you get clues, as in the triangles. Sometimes you can work it out "as you go" by measuring pullbacks and counting waves. Point 3, I can't really see a triangle....but hoping for anything heading into the close is NOT a good idea. It's never a good time to hope, but the worst time is heading into the close.....
Chartman.
Attachments
I notice that there are a lot of reads on the first day of the week..... To save you all some time and wasted effort, I rarely post anything until the close..... I open the thread so that if anyone else wants to post, they can do so.
It's a while since we've had a substantial bottom so some of you may not know about the 4 slope changes that can be a useful guide in determining this. You can also see the "W" bottom formation today as well. I'll expand on this in the 1 min thread.... It is no coincidence that the high at 128 was the old support line- this was extrapolated from Friday, demonstrating the importance of getting your S/R channel lines in place. They are RARELY as the textbooks say- across the highs/lows or opens/closes... They are better placed where they "look right". Strange, but true.
To get out of this, we'll need to see 120 back as support. Until then, wait and see.
Attachments
TraderTony
Active member
- Messages
- 180
- Likes
- 1
Healthy start to the week
Took a long off divergence/32/yesterday's low shortly after the open (9:38est) and closed for +13 on resistance at 100ma. In retrospect I'm not sure this was a wise entry - probably more a gamble that got lucky.
Reversed short on move back down from 100ma at 10143 and exited on triple PD at 10070 for +73 which was very nice indeed.
I sat on the side for the rest of the day but if I'd continued I would probably have taken a loss looking for the next pullback from the 100ma (had I not taken a gamble long first on the PD) and then perhaps a win on a long pullback to the 100ma, exiting on the ND around 10135.
86 points is a big winning day for me - if I can do 25% of this regularly I'd be more than satisfied.
CM - if you do take a gamble entry (say on divergence) the 'wrong' side of the 100ma, what do you normally do when and if prices reach the 100ma? I'm inclined to think it might be a good place to take profits before seeing which way prices are going to go, but would appreciate any insights you can offer.
Many thanks,
Tony
Tony
Tricky start, but if you took the failed bull triangle as a short, the 100MA rules would have kept you in on the right side of the trade even though it went 30 points off the low- hard to take sometimes, but the stop had to be above 148. If you had the stomach for that, you would have been rewarded with 80 odd points.... If you didn't have the stomach and bottled out, maybe your stake size is too high..... With patience, at 16:30 as the drop through that triangle support ( and the failure to break up through 32) you could have doubled your stake..... being ready to off load again if 32 broke- 8 points away. You should also have already calculated T1 which duly delivered. That lead to a mini bear flag, and T2. If you added at the triangle break, you should consider off loading half at T1... In any case, always offload at T2 if you are above your normal stake size as this is always close to the end of a swift move. OK, so it might just drift on down...It might also bounce back up...as it did in this case by 18 points.
And so to the drop to 62.You can see the PD clearly now, but on the second peak, there was no PD. You had to be smart on the button to get out here, although there was a second, more pronounced PD that bottomed out at 64 to give a triple bottom.(67,63,66)
The downside of taking the first PD was that you may have been tempted to take the 100MA breakout ( just) and suffered a hit. Taking the third touch on 64 made a perfect entry with triple bottom and off 64 and an out on the ND top. Plenty of warning here! 2 pk PD and 16 mins gave a target out time of 19:46,the top coming 1 minute later as 32 failed to hold.If you clocked that lot, you may have felt brave enough to reverse at the top- another 'lucky' choice.....
So another 100+ but needed care and attention, and a bit of luck. Chancing to luck is NOT a good strategy.... This is where you are most likely to undo a whole day's hard effort.Just as you are thinking you are invincible.Bin there, done that. 🙁
Attachments
ChartMan said:I notice that there are a lot of reads on the first day of the week..... To save you all some time and wasted effort, I rarely post anything until the close..... I open the thread so that if anyone else wants to post, they can do so.
It's a while since we've had a substantial bottom so some of you may not know about the 4 slope changes that can be a useful guide in determining this. You can also see the "W" bottom formation today as well. I'll expand on this in the 1 min thread.... It is no coincidence that the high at 128 was the old support line- this was extrapolated from Friday, demonstrating the importance of getting your S/R channel lines in place. They are RARELY as the textbooks say- across the highs/lows or opens/closes... They are better placed where they "look right". Strange, but true.
To get out of this, we'll need to see 120 back as support. Until then, wait and see.
Where is the one minute thread?
Looks like the 1 min thread went into cyberspace and got lost.... anyone delete it by mistake?
For general targets, read a good book on TA.... For triangles , take the height of the mouth and add subtract it from the breakout.
Or search for targets on this BB.
I just don't understand this. The 1 min report from last night has been round the universe twice and teleported back to the thread a day late.....Sharky, what's going on? :cheesy:
TraderTony
Active member
- Messages
- 180
- Likes
- 1
Made a bit of a hash of today...
Went short shortly after the open at 10095 on move down from 100ma which looked ok once the trend line on the rsi had evenutally broken but it turned round from a low around 10075 and moved all the way up to about 10115 without a pause or clear exit signal that I could see. I then got stuck holding the wrong side of the 100ma as it slowly crept up, testing but never breaking through the 100ma to the downside (or hitting my stop to the upside). I eventually took a 20 point loss on the 5th or 6th failed attempt but should have exited much sooner than this for a small loss.
I then eventually joined the upside at 10115 at 14:10 est on another retrace to the 100ma. I exited swiftly on triple ND around yesterday's HOD at 10148 for +33 feeling very relieved (and somewhat lucky) to be in profit overall and sat on the sidelines for the rest of the day (which was probably a fortunate decision by the looks of things at the moment).
Overall up 13 points from 2 trades, which is no bad outcome considering the mistakes.
TT I'll have a pop at you later.
I didn't reckon the action would drop today, but there we are. What we did get that I did reckon was the pullback to support to confirm the break.Ordinarily, this looks ok but the last day's action could well be a correction to the channel (NOT the slope, but the offset) . BUT a quick peek at the ES futs shows after hours up 5 points ( Dow 45 ish) on big vol so someone has done a good post bell numbers job on reporting I guess.This might be enough to move us up out of the channel or move the correction upwards.
IF it's a reversal, you now need to "guess" the most likely profile of the up channel, which I've done. DOES IT LOOK RIGHT? If it does , then there is a consequence.....The pullback has held at the old downtrend support at around 110. This is significant because the normal course would have been a drop to the "suggested" uptrend support around 087. This 'failure' would suggest a further break.
Wait and see.
Attachments
Leave the 10 min lines in place for tomorrow. They'll be important, even though the rising support is a guess.
Complex or what....Most important thing today is to recognise how a bull triangle sometimes breaks with advance warning.In this case , you had around 10 mins to think and plan.What happens is that you have the support line on the triangle, then towards the apex, you find an increase in the support slope as one of the troughs fails to make the support line before turning north. You have two choices- one will be to get in early the other is to wait.Getting in early has benefits.
1. You can get in at a lower price before it flies- that's more $ in your pocket.
2. You are closer to support and in the event it fails, your losses will be smaller.
Or you could wait for the break to be confirmed. That was at 19:01 with the pullback to support. Not a lot in it either way.IF you are unsure, wait for the break!
Complex out on the ND. Unusually , split across different times. with 4 peaks. Even if you took the third, you only dipped out by a few points and in this case, waiting for the fourth ( and that big down bar,) you would have ended up the same in all probability. Only the 100% disciplined will have the balls to get out on the right peak...... I bet there's a few, even now, that may be thinking " there might just be a bit more in this".....
OK TT. Going short ( or long ) at the open, there has to be good reason with two or three clues to force the trade. Going short here you needed to be aware of support at 66-72. the turnaraound at 73 should have had you thinking of covering!!! Second chance was the mini pullback around 78, then 85.... How many did you need? In all , I can see 6 or so pauses.OK some were just a 1 min black bar, but that's enough to confirm it's not going down any more! Higher highs and highr lows are the Key to remember....
No mistake on the second trade. Perfect exit. Take a bow.
Attachments
Chartman
Would you mind posting a chart showing entries based on the 100 ema rules, for 07/20/04. I have been reading the file uploaded last week, on your 100 ema system, and It would really help if you pointed out some entries. Hope it is not too much trouble. Thanks
Max
Would you mind posting a chart showing entries based on the 100 ema rules, for 07/20/04. I have been reading the file uploaded last week, on your 100 ema system, and It would really help if you pointed out some entries. Hope it is not too much trouble. Thanks
Max
bansir
Well-known member
- Messages
- 494
- Likes
- 42
Yes, you could take it, onthe basis that may have been more to come than actually did. You don't know that at the time though....although your target calc is spot on, it didn't make it in on run. ( the stop out pullback).
So what happened today? We got waht I expected yesterday, but then why the drop to hell?
Just goes to show that the best laid plans and correct analysis can be undone in a twinkling of an eye. 🙁
So what happened today? We got waht I expected yesterday, but then why the drop to hell?
Just goes to show that the best laid plans and correct analysis can be undone in a twinkling of an eye. 🙁
Attachments
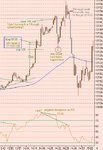
Phew , 200 points? A few at the open to the ND top on 32, and almost 200 on the short... Apart from the feeble attempt around 200 to briefly move above the 100MA, it never really came close all day. Look at the RSI v price rises 1 - 6 totally weak.Nothing really to get measured moves from, except the last move down from 160 to 60. If you closed anywhere other than at 060 you need to figure out why. It's moves like this that will protect you from lots of mistakes. You must capitalise on them.
Attachments
Similar threads
- Replies
- 902
- Views
- 131K
- Replies
- 12
- Views
- 5K
- Replies
- 21
- Views
- 8K