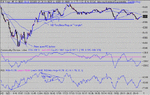
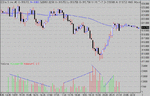
No prizes for guessing where I thought the dow might go today 🙂 I had hoped that the triangle would break to the upside to continue the rally. Anyway, a quick look at where we can get suome support and resistance first. As divergence set in early on in the day and continued thoughout, it's reasonable to presume that we're at support, or not far off... I estimate the triangle target at 8480.... ( or 8920 for the upside break).
You are using an out of date browser. It may not display this or other websites correctly.
You should upgrade or use an alternative browser.
You should upgrade or use an alternative browser.
No real clues as to where the bottom was going to be. There was pos. divergence early on , along with RS switch, BUT I have said before, an opening drop that shows pos. divergence from the open CANNOT be relied on.
The safest way to play these is strictly by the 100MA rules- stay in all the time the price is under the 100MA and look for a bottom confirmation or wait for a break above the 100MA with confirmation pullback. In any event, you should have stayed in today until the close. Unfortunately, this is very hard to do. Boredom sets in and one finds ones self LOOKING for the bottom and a long entry. There is no easy way round this . You'll find yourself making all sorts of excuses why you shouldn't walkj away and come back later. IF you can place stops, this is the ideal situation to do it. Worst case, a 20 point stop would have got you out at around 8500. Not far off the lows.....
The big retest at 8600 gave us a target of 8520..... The triangle at 16:00 gave a target of 8510... note the magic numbers resistance at 32's and 64's.......
Attachments
Hi Chartman,
Firstly, thx for an excellent series of postings - trully brilliant.
Bit of background - I lost (as many of us did) a lot of money during the dot com years - went in at the top and got out (or in some cases didn't) get out at the bottom.
Thankfully, I'm an IT contractor in Investment Banking so although the loss was heavy, I was still making lots to see me through - not that I've recovered from my lossed - still hugely in debt.
Anyway, after that fiasco, I though I'd try spreadbetting the dow - opened an account with Fins, put in a small amount of capital and made some money - for a while anyway. I was just a momentum trader, watching the 1 min charts like a hawk (just the price - nothing else) and trying to predict the market on news etc. Found that I was making 7-10 successfull trades in a row - nothing big - used to take my profits and run - never saw the big one. Trouble is as soon as I figured I had an uncanny knack at trading indices, the big one came along and I lost a large % of my capital - back to square one - this time doubling my stake and taking chances to build my capital back up again - only to lose it once again .......
I'd been reading your posts, signalwatch etc whilst I've been trading, but only to try and 'predict' the markets. Didn't work ! Could never get into the signawatch way of trading - kept on trying to refine Ed's methods 🙂
Then you started the current daytrading series - hurrah I though - read through the the first few days and got promptly lost with the TA. Gave up! - until 3 weeks ago - stepped back a bit, did some reading on TA - spent ages digesting all your current series and it all finally clicked. It all seems so easy!
Decided that I was going to aim for 100 Dow points a week on average - not too difficult with my newly found skills 🙂 Be a nice way to supplement my falling income (with the way things are in IT and Investment banking 🙁 ). Started paper trading last week and came out 130 points (minus the bias) ahead. Not bad I though, in a difficult week.
So, this w/e I sat through all your posts again, analysed, digested etc. I'm ready I thought. Monday came, market dropped - I sat there frozen. Looking for a pullback to the 100 MA (which barely happened - and was unlikely to do so on a day like yesterday). Spotted the RSI divergence - nope can't go short now market is gonna bounce - great spot - NOT. All the time I was thinking that If I short now, markets gonna turn like it used to when I didn't know TA. The divergence kept on going and I just sat there - doh ! kept on looking for a bottom - nothing. Didn't enter a position all day as the dow kept on falling.
So, by close I was mad. What did I do wrong. Sat back and started analysing - it was a combination of not going short right at the open and the RSI divergence - ok I could handle the opening short but the RSI got me. And then, I remembered what u had posted a little while back - 'Divergence on opening is unreliable'. Damn ! Waited eagerly for your report and thankfully you confirmed.
Hopefully I've learnt from this - at least I obeyed the rules and didn't go long - nothing lost nothing gained.
- Messages
- 2,325
- Likes
- 17
Nice post Mombasa, and welcome to T2W.
I think you acted correctly - standing aside IS a position. You appear to be slightly unsure of the signals the market gave, therefore you did the best thing possible by staying out. I bet there are a few peeps who wished they had stayed out yesterday!
It's not often we have a market day which trends all day, so it was unusual. Trades are like buses, there'll be another one along soon - and if you've had a 'chequered history' in trading, it's best to wait until a really good trade comes along. That gives you confidence and familiarity with the signals you see. 😀
Agreed , Skim, staying out IS a position. It takes patience too. IF you run out of patience, stake 10% of your normal size and "play". At that low stake you can take a chance, have some fun, and avoid the boredom and risk not a lot.
The open divergence IS very tricky . It's best NOT played, rather waiting for a confirmed turn around which just didn't happen yesterday. So far today, it's equally hard with 30 point swings.... but it looks like it may just be breaking at 17:15. An Inv. H&S with a break over the 100MA and a pullback to 8520.... but it's USA tea time....
I'm glad you're benefiting from the posts Mombasa. :cheesy:
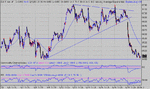
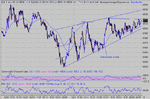
A long at the open seemed a good plan, but didn't work out 🙁 So look for the next entry. Off the Inv H&S at 8492 with target T1. Just above the 100MA and a pullback right on the spot was a good entry. Troble is, it went straight into a 3 pk nd top for only 30 points. Still, at least there was the 3rd peak to get out on for a plus, all be it a small one. Just remember, at the time you just don't know how big or SMALL a move is going to be. You can only work to targets and none appeared until the 2nd peak in the divergence. it gives you 15 minutes or so to plan your exit and watch like a hawk. At least you should have the satisfaction of getting out at a top and not many people have a clue how to do that.
Next entry- gamble on a reversal or wait? Your choice, but mine was wait. With only a few points in the bag, there was little leeway to play with and we don't want to give back what we have just won. The wait turns good as the price drops through the 100MA with multiple retests at the 100MA so plenty of opportunities to get your short in.The minor bear flag through 8510 gave a near target of 8480 ish. Next target down was the mini bear flag through 8500 giving T3. The big bear flag through 8580/90 gave target T2. This should have kept you in all the way down to the bottom....The rise off T2 was probably enough to make you cover.... close enough to the real bottom not to worry. Don't be disheartened that you can't get a bottom or top exactly- it takes time, skill and experience. It WILL come with time and you'll never do it all the time. So that move should have bagged 70 - 80 points- more than enough to be happy with.
Next entry? Feeling lucky? Don't get tempted.... well, how about a half stake entry as the price makes a higher high off the bottom at 8443, just after the little pullback?
Reasonabe gamble. There was just the minimum of PD across 25 minutes so I'll allow it. 🙂
The SAFE entry didn't come until the price went through T4, the target from a "loose" Inv. H&S bottom. This is the place to "top up " your half stake with another half, taking you to a comfortable full size.
The text books say that the target is the neckline- I'm not comfortable with that- there are failures around this point which can be avoided by waiting just a little longer..... That bull flag just below T4 has a target of 8470.... The final target with two sources was at T5. the first derived from the second pair of shoulders across 8460 and 8470.The second source was the pullback from 8480 to 8470. Both target giving the same answer. Time prevented it reaching target.Close for another 30 - 50 points.
Attachments
bansir
Well-known member
- Messages
- 494
- Likes
- 42
pullbacks
Hi Folks,
Just an observation really for what it's worth.
Some of those pullback opportunities for short entries between 19:19 and 19:43 look good with hind-sight but there was a common challenge built into each one.
Instead of nice gentle pull-backs made up of spinning tops we see huge, enthusiastic white candles making convincing lunges for one's stop levels.
These were then answered immediately by equally prominent black candles to continue the down move.
I've found it plays havoc if you're spread betting since the moves are amplified.
I've noticed this sort of strong reversal feint played out many times, three in a row may be uncommon?
Is there any explanation for it in terms of market psychology ? Ultimately I guess we accept it as all part of the game.
Thanks for your posts Chartman.
Best Regards,
Neil
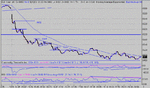
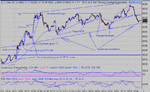
A hard day, continuing off the bottom Inv H&S from yesterday. Making target today at 8510 area. Nice uptrend channel formed giving a good stop support now as well as a break resistance line. Nice triangle brewing at the close,and above 8500 so I'm looking for a break to the upside tomorrow.
Attachments
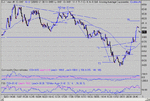
A better day today, with a lot of opportunities to trade off targets. The key was getting in an early long. The first catch was the ND top that only spanned 20 mins or so. I thought this would only drop a bit and then continue. You don't get many short ones that perform, so just a remider here that things don't always perform as expected!. Take a note that on ND tops ( and PD bottoms) there is always the underlying uptrend support break to watch for ( and the downrend resistance) as a safety net.....
The mid session bul flag failed to get to the target of 8633 and developed into a bull triangle that also failed. That just made target of 8578...
CCI..... there's been some questions about this.... today it came into use at the triangle failure bottom. Nitice that CCI hadn't really gone below zero all day. At this bottom, it went to -147- a safe long entry in my opinion as it headed towards zero.... and RSI went through 0 ( 19:35)
Note yesterday's extended resistance line that is now support. Watch this line tomorrow.... Failure will drop us back to horizontal support at 8520. We have a decent uptrend channel today on which to base some decisions tomorrow...
Attachments
DOW
Hi All / Chartman
I have been following this thread with interest and slowly getting to grips with real- time the problem im having is using multi- time frames im looking say at the 1 min that maybe going down while the 10 min maybe going up and so i confuse myself as what chart to trade from, as i know you guys/girls use multi - time frames should i just have the 1 chart up and just trade that or trade the direction of the longer time frame HELP PLEASE and a great thread Chartman . cheers mark g
Hi Chartman,
Once again, great commentry to compare with the way I traded yesterday - excellent for figuring out my mistakes 🙁
One question, at the open when DOW went to 8540 there was (to me) RSI divergence ie RSI was flat while price was rising - is this something to take notice of or does it have to ND or PD specifically. It's not something I've thought about before and I closed my long because of that (though the market might get choppy). I then missed the rest of the rise 🙁
Thx
Mombasa- I have RSI (14) going down then. Either way, IF RSI and price don't match , then they are divergent. It doesn't matter if RSI is flat or the price is flat. I'm not sure about how much significance to attach to the fact that RSI is flat as 99 time out of 100 it has a definite slope.
OK let's take a look at this "real time", so the chart is about what you may be looking at, at the time, + a bit to the right....
The price does have negative divergence on RSI as you say, BUT.
1. It's unlikely to be a top.
2. The time span is less than 25 minutes.
3. There isn't the characteristic 3 peaks in the price.
4.The lack of any "gap" indicates continuity from yesterday.
I can see no reason why to close a long position anywhere here. What you can pick up from the divergence is that there SHOULD be a pullback /correction/breather soon. Call it what you want, but the price will drop. How much? Who knows.... This is the type of "noise" you have to put up with trading a 1 min chart. At this point, if you were unsure of your position you should have :-
a) Looked at different time scales- 5 min/10 min/30 min.
b) Check your position size. If you were spooked here, maybe your stake was too big?
c: If your stake size is right, you'll have plenty of time to look at the other timescales to re-asses the options and make a clear, better informed decision about the move and where you will get out IF your analysis was contraray to where the market wanted to go.
I'll STRESS my last comment. Most traders , generally, ( on this bb I hope at least) will be making good trading decisions based on whatever their reasoning. Get it into your mind set that you always do this. WHEN the price goes against you, It's the market thats going the wrong way, not you. So close it off immediately and say NEXT move. Don't even think along the lines" It'll turn round in a minute"......
Attachments
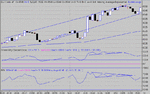
So after I've been prattling on about how unreliable an open divergence is, we get one that does the biz. Ok look very carefully and you'll see why it delivered. Recall my recent comments about how over time, the shape of things change, and in particular the "shape" of ND tops . Well here we have the current in fashion "bump in the middle". Perfect timescale- 40 mins and that characteristic bump. This differs significantly from most open divergences that tend to have an extended slope//res/support line that eventually turns up wherever it decides.
OK by the same token we were discussing the top "divergence" that developed between 16:00 and 17:00. Now, some could have been forgiven for thinking what they did. But it didn't have the chacteristic shape, so I dismissed it. Principle reason the recent high on RSI- 78. It just didn't look right either..... I called it as a traingle with a target of 8635 that never made it. Either way a messy call- first it broke out, then it looked like it was going to fail, then it was off again, before finally expiring.
Back to the open , it was not long before the guys in the chat room were calling great targets and, surprisingly, we were all in the same ballpark within a few points. Very refreshing to see. Adds to everyone's confidence that the market was likely to get there.
Bad call of the day was my " short below 8605" at 17:01...... The price dipped to 8603 and then turned round to 8625.... Just goes to show that any targets you arrive at should have a bit of leeway. My error was not seeing the obvious block at 8600.... the short should have been below 8600. And then it should have been after a pullback to the 100MA....
The bottom line is this. Some called it an ND top and shorted early. I called it a triangle that failed and was waiting for the uptrend support line to be breached at 8607 ish which it did. In any event, we were all wrong. Seems the correct support line was the one starting at 8590 at 15:58. Surprising what a small difference of opinion in trendlines can lead to.......
The rest of the day was just a paint drying excercise.