Dow Intraday charts 12/07 to 16/07

Hi All
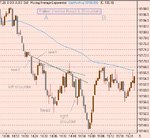
Had a good day on the dow yesterday but could be some luck involved. Read the vertical line on RSI starting just after 15.08 and ending 16.39 as a P/D. Slope on dow from 10190 to 10175. Entered long read the pause on dow at 17.05 to 17.31+ as half way house (thought channel CM says triangle) target then 10225. Targets give me more confidence to stay in a trade. 10225 hit, Rsi over 70, 10232 fails, enough for me and out. Wish I could do that everyday clinical trade with no emotional (Fear/Greed) involvement.
 
Hi CM,
I dont know how it works but the dow has just bounce off 10163.59 triggering one of my stops on Dell.
What a great targeting tool.

cheers

Triplepack
 
Wicked or what , eh? short from 32, cover on 64! sometimes they work to perfection. Still don't know why. :(
 
That was fun...

Well, I didn't quite get the short from 32, but I got in on the failed bull flag after the open at 10:05 est (10210) and out at 64 (reinforced by 64 being at or near the closing of the gap, T1 from the intermediate bear flag and yesterday's low) for 46 points.

I then went short on the retracement at 11:21 est (10188) and whilst it went sideways for ages I finally exited at 15:00 est (10150) on formation of PD for 38 points.

Still paper trading (and taking actual trade values from the MiniDow (YM), which is my usual trading vehicle).

Happy to call it a day here with one hour to go - have a good weekend all.
 
From yesterday- short below 150 was a bit pointless, but watch support at 150.... I should have said 140. :cheesy:
Same again,if 150 140/ goes,all is lost :) Still sitting in that down channel, and now with 3 days divergence, which is the norm for a turn to start, but don't jump the gun...
 

Attachments

  • dow 16-07-04 10.gif
    dow 16-07-04 10.gif
    38.2 KB · Views: 227
1 min chart speaks for itself. Maybe it's time to add a rider to the 100MA rules.... I know a lot of traders will exit a trade if within a short time the trade is not going into profit. Today's action is common, in the lunchtime 2-3 hour period- just goes sideways. Is it a good idea to be sitting on a trade for hours that is going nowhere? Easy to get out and walk away if you're on DA, much harder if you're on SB. At the end of the day, it's a 50/50 gamble as to whether your trade is going to win or lose. So wouldn't it make more sense to exit at the first opportunity after , say , an hour of being stuck in the 100MA band? That would/should help cut down your losses overall. If it's going to be a loser, it will probably be at least 20 points..... with the band running 175 - 90 and flat as opposed to gently sloping, one could get out,theoretically , with a smaller loss. This pre supposes that you have the mental frame of mind to accept a loss there and then as opposed to waiting to see if it comes good. Hard one to call bot worth some serious consideration.
 

Attachments

  • dow 16-07-04 1.gif
    dow 16-07-04 1.gif
    27 KB · Views: 260
Hi Folks,
Thought I might balance things up and post a losing trade, a bit negative maybe, but I'm just trying to learn from my mistakes.
Perhaps it's worth taking care with line construction; I got caught out by a failed Inverse Head and Shoulders pattern yesterday.
I drew in 'base 1' and started looking for the right shoulder.
If I had joined the closing/opening prices, I would have had 'base 2' drawn in which was not breached and therefore gave
no confirmation of the pattern. Bear in mind of course, you can't see any of chart region 'B' whilst trying to draw the base in !

For me these are tricky patterns to trade with and for spread betting the target exit prices are almost always too small to give a decent risk reward ratio. Also I was looking to play against the 100ema (and I lost).
Did anyone else fall for this or was it just me? :rolleyes:

I think I'll stick with nice clear bull/bear flags following 100ema breaks just for now anyway. :cheesy:

My stop just below the right shoulder came in useful ;)

Cheers,
Neil
 

Attachments

  • cm-16-07-04.jpg
    cm-16-07-04.jpg
    83.2 KB · Views: 254
H&S and Inv H&S are one of the not so good deliverers on the Dow. Take a look at the gif. IF you want a safe entry off an Inv H&S you must wait until the top horizontal line. This has been derived empirically over time. Forget what the books may say. You know the left trough, you know the bottom and you will know the right trough. Draw a line through the two troughs. The price rise to delivery is taken from the perpendicular of the low to the intersection of the line across the lows. Add this value to the intersection. When the price rises through this, go long, but take care. If you get a pullback to the 100MA here, then the odds are going your way.
Did you realise that a bump top 3 pk ND and the converse the bump 3pk PD are in fact 'stretched' versions of the H&S ind Inv H&S.....
 

Attachments

  • Inv H&S.gif
    Inv H&S.gif
    3.8 KB · Views: 258
  • BUMPTOP_ h&s.gif
    BUMPTOP_ h&s.gif
    4.2 KB · Views: 245
ChartMan said:
H&S and Inv H&S are one of the not so good deliverers on the Dow. Take a look at the gif. IF you want a safe entry off an Inv H&S you must wait until the top horizontal line. This has been derived empirically over time. Forget what the books may say. You know the left trough, you know the bottom and you will know the right trough. Draw a line through the two troughs. The price rise to delivery is taken from the perpendicular of the low to the intersection of the line across the lows. Add this value to the intersection. When the price rises through this, go long, but take care. If you get a pullback to the 100MA here, then the odds are going your way.
Did you realise that a bump top 3 pk ND and the converse the bump 3pk PD are in fact 'stretched' versions of the H&S ind Inv H&S.....

Thanks CM,
Very useful; I didn't realise the correlation between bump top 3pk ND/PD's and the H&S patterns.
As soon as I have to draw very sloping base lines I always get a little doubtful and feel I'm forcing the pattern into existence.
I'll give your construction technique a go and look for clearer formations.

Best Regards,
Neil
 
H&S. formation.

ChartMan said:
H&S and Inv H&S are one of the not so good deliverers on the Dow. Take a look at the gif. IF you want a safe entry off an Inv H&S you must wait until the top horizontal line. This has been derived empirically over time. Forget what the books may say. You know the left trough, you know the bottom and you will know the right trough. Draw a line through the two troughs. The price rise to delivery is taken from the perpendicular of the low to the intersection of the line across the lows. Add this value to the intersection. When the price rises through this, go long, but take care. If you get a pullback to the 100MA here, then the odds are going your way.
Did you realise that a bump top 3 pk ND and the converse the bump 3pk PD are in fact 'stretched' versions of the H&S ind Inv H&S.....

Hi C.M. Very interesting, I assume the above also refers to an H&S. Do you know if it works also on stocks? In the case of the H&S I am referring to the entry point.

Eddy.
 
Last edited:
Yes it's for H&S too.
Just remember that each instrument has it's own characteristics. What works on the dow may work slightly differently on something else, or maybe not at all. That is for you to discover about stocks. I simply don't know. The wide dynamic range of the dow makes for easy pattern recognition.... so when I see something on the Dow, a quick look at ES often doesn't show the same thing, and if it does, it's nowhere near as obvious.
 
Hi C.M. Thanks I half suspected what your reply would be, I notice you refer to ES a lot in your posts could you please expand a little on how it corroborates your DOW trading, ? I am not even sure what ES is, is it the mini DOW, and how isit accessed.?

Eddy.
 
ES is the futures version of the S&P 500. Traded / favoured by a lot of people. 'Contracts' are valued at $50 a point with 1/4 point being the smallest tick size. Equates to roughly $5 a point on the Dow. Access is like any other chart....
 
Top