Dow Intraday charts 03/11 - 07/11

ChartMan

Legendary member
Messages
5,580
Likes
47
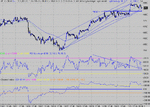
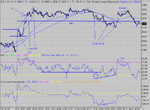
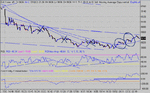
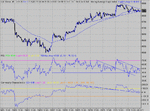
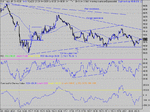
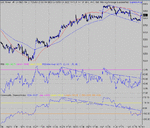
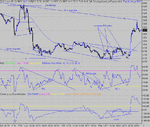
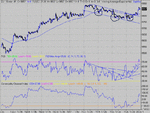
Longer term.... Reduce your stake and widen your stops... Make sure you look at 60 min and EOD charts. At the moment we're looking at 50 -60 point pullbacks so that will give you an idea of what you have to do. Can I suggest if you're going to switch now, go with 1/3rd your normal stake and 60 point stop on Dec Futures. IF your trade goes in your favour AND looks like continuing, try adding 1/3rd at a pullback /support off the 1 min charts, and then consider moving up /in your stops.Look at the current trend and try and decide what IF etc, as the price went up. Move up your stops to lock in profits at major support points. The triangle was met from Friday's triangle + 10 points. Support is at 9850, then 9832, then 9800. If the price breaks 9880, your last stop should be 9832. IF 9900 goes, move it up to 9864/9850. Remember from the 1 min charts, that 64 is a likely test point and may drop below and then back up. Check other factors if this happens- i.e RSI ratio/divergence etc.before a final close.The 100MA works well in 10 min too.Note we are at support in RSI (40) and CCI is mostly >100.
Take care, you need to develop a different mind set. Knitting is HIGHLY recommended!
 

Attachments

  • dow 01-11-03 10.gif
    dow 01-11-03 10.gif
    29.3 KB · Views: 912
Two nice entries today. First at the open on the pullback, esp. as it was to the 32, and had a target of 75.Small test at 64 and then on through, passing 75 , to make an uncertain ND top. Uncertain because of the bigger than expected bump in the middle peak on RSI.Timescale was ok at just under 1 hour. Then a patient wait for another entry. Hope you didn't get tempted at the loss of 64, as there was a PD developing...There was also a chance of taking the short at 16:41 on the pullback towards the 100MA.... Either way the smart entry/switch was at the PD 3rd peak of 9850.
 

Attachments

  • dow 01-11-03 1.gif
    dow 01-11-03 1.gif
    26.1 KB · Views: 900
Thx CM - will certainly play with 10 min for a while - still keener on 1 min but lets see .....
 
Chartman
Now sorted with Sierra/Mytrack, and I'm very pleased - thanks a lot!
Got a question about one topic - PD's. You mentioned the clearcut one yesterday, and I just don't seem to be able to pick out the pattern. Any suggestions?
Cheers
Quercus
 
Quercus
First, make an assumption that there is a likelyhood of a bottom. This will usually be at RSI low of the day ( 18:35 yesterday) although near enough is good enough.
Your next observation will be that around 15 min later ( MINIMUM!) there will occur a higher low on RSI, and a corresponding lower low on the price. (19:13) this was 38 mins later, quite long.
Now you can "expect" a three peak positive divergence bottom...
Lastly, extend the trendline drawn under the two lows of RSI. Use an "autoextending line" if you can ( Sierra does this). Now look for a final low in the price, that is in a similar time gap to the first two lows ( 38 mins), AND a corresponding further higher low in RSI ( 19:39). Time gap 29 mins, a bit shorter.
Clear cut means that all the criteria for a divergent bottom were met. These are MINIMUM time overall between the 3 peaks is 25 minutes. The 3 peaks on RSI should form an almost perfect line. There should be no BIG bump in the middle peak on the price. ( we had a small bump).
In contrast, the opening Negative Divergence was NOT clearcut, insofar as the RSI trend line had a BIG bump in the middle.
Things are never 100%, but there are excellent opportunities presented by the dow that can be traded to perfection, or as close as you're going to get to it. I would go so far as to say that one could nicely beat the SB bias on a divergent top or bottom, by taking an early exit or entry, before the bias flips against you.
Finally, BEWARE an opening PD bottom that appears VALID in the first 30 mins! These have a nasty habit of going on down for a lot more..... 60 - 90- mins at times. Don't jump on these. Wait until there is a price confirmation of higher highs AND higher lows off the real bottom.
 
Thanks CM.
I just made a Pratt of myself trying to imagine what one was!!!!! Only made a small loss.
Cheers
Q
 
( July 10th 2003 )

Here's an open that just went on down and down. The higher high and higher low didn't happen till very late in the session. The first circle is debatable whether it fits the criteria, the second circle certainly does. Notice the aditional clue for confirmation- the CCI line where it's trend line is broken and pulls back to confirm support.
 

Attachments

  • dow 10-07-03 1 mina.gif
    dow 10-07-03 1 mina.gif
    20.8 KB · Views: 810
Looks like crunch time. The drop in RSI to 30 without the price tanking suggests no strength to go down. Otherwise RSI has held support at 40. CCI has an SR switch and this needs to hold...100MA breached by 10 -15 points max. Given the choice, I would be closed now and wait for a move. The triangle has a target of 9950 or 9750. I don't count too much on which way a triangle will break, unless it's clear cut. This one isn't.Unless you know different. :cheesy:
 

Attachments

  • dow 04-11-03 10.gif
    dow 04-11-03 10.gif
    29.7 KB · Views: 752
Another example- open divergence that worked over30 mins. But the safe play was still to wait for the HH/HL.( around 15:15.) It also bounced on the 10 min uptrend support line. No nd top so where to get out? The old resistance line wasn't met so that was a clue. The next is the RSI support line break at 16:44. Now you either look for a short, or find a bottom. There was a short at 17:20 as the price drops the 100MA and pulled back to 9855. Not a big points winner, as it turns out...... Classic PD bottom,topped off with a double bottom at 9828, and time for a long. RSI ratio weak all round so no big moves....Not an easy day.
 

Attachments

  • dow 04-11-03 1.gif
    dow 04-11-03 1.gif
    27.9 KB · Views: 738
Chartman
Thanks for posting the older chart - it's very clear.
I had to do a double take and then had a bit of a laugh when I saw the date! Thought I'd set up all my Charting stuff badly!!!
Cheers
Q
 
Cisco results out after the final bell, as my e-mail says, could be the last bit of good news for a while, maybe a chance to dump at the top. :D
 
Why not? It's only 210pts, 2.1% and round figures do tend to work as magnets. Lockstock might also be right that good Cisco figures will rally the market. That said, it seems that everybody agrees that it a great oportunity to sell into a Cisco triggered rally.
Therefore, as crowds are always wrong:
1. The rally will not materialise, or
2. (nevermind market being overbought) will rally and get even more overbought as Shorts seeking cover.
3. You fill in the other infinite scenario's.........
 
Nice down trend developing, or was until the rocket at 20:30... Still keeps us in a channel. Fantastic divergent volume spike on ES from Monday's close to Today's open. Not that I took any notice of it...... apart from thinking it wasn't going to work.... :(

Not a very profitable or solid start to trading the 10 min ....
 

Attachments

  • dow 05-11-03 10.gif
    dow 05-11-03 10.gif
    32.1 KB · Views: 621
Interesting day in the end! Long at the open as the price went through 32? and a stop and reverse at the double top at 10 min resistance... Nice move that failed to make target T1, but not before a PD set in. The initial 3rd low on RSI was followed by another one, but the price didn't go lower. Lucky. Could have turned out to be one of those never ending opening PD's. :cheesy: As it turned out, there wasn't a decent rise to follow... You could have bailed out on the 4th high at 18:05... for break even, just. Or held. You should have closed , really, it was going no where.... Then there was that big spike up. Initially it seemed there were no clues, but there was. Another PD bottom, both on RSI and CCI. That gave an entry at 20:08, and from there a nice 40+ points. I wasn't thinking about RSI ratios at the time, but the clue is there too. Each of the up and down pairs had increased strength/ decreasing weakness. Easy to see after the event.
Rumour has it that the market is waiting for Friday's figures on employment. STAY OUT!
 

Attachments

  • dow 05-11-03 1.gif
    dow 05-11-03 1.gif
    28.3 KB · Views: 667
During these days with mid-day range trading, i noticed that indeed the RSI ratio analysis has provided me with improved confidence in predicting the next move. I was lucky today shorting on a safe-entry after pull back to 100ema at 15:20 when Dow quickly dropped. Although there was RSI PD, I stayed the course most of day as the RSI ratio was very weak. As you CM mentions, this ratio strengthened slowly afte,say 18:45 and I was was lucky to cover (for 35pts) at 20:00, just before DOW rallied. While i saw strength coming in, i just couldn't act / was not aware enough to go long on breakout of price, RSI and CCI. It went very fast. Within 5-10min, Dow captured 35 out of 50 pt rise.
CM, any tips how/why I could have had confidence putting in a buy stop on this move?
Apologies for ignporance but what do you mean by volume divergence in ES between Monday close and wednesday open? I am not sure I could detect a clear pattern on my charts, other than there was marginally more volume on tues down day than on mon and wednesday? Otherwise, it seems to me that most momentum indicators on the daily charts pointing to a market which is very tired.
Once again thanks for analysis.
 
and I thought there was a bear flag developing on the 10 and 15 min - until the spike up !

yup, not very profitable tradung the 10min - I'm still short but thankfully I'm still doing the 1min. Made a mistake going short on what I thought was a pullback after the starting drop - lost a few points there but then got the next 4 trades right - ok only made a few points scalping after the dbl top 30 odd points but it's nice for one's confidence.

BTW, this was all thru Capital Spreads demo account - much better than fins with the spread and bias!
 
Bgold
The only way to trade that spike would have been to have been actively looking for a PD bottom, and hit the button spot on... if you dithered, the bias would have no doubt eaten you. That spike was unusual off the PD bottom. Normally, you'd get a nice take off, that suddenly makes you realise you've misssed a PD, and you can jump in. Not last night.
The vol divergence is on a 1 min chart, not eod.
Mom
100% right on the bear flag . Market just didn't do what you knew it would! ( thought it should). That's why we have stops. TA 100% right, market 100% wrong.
 
CM - on the other hand, on 10 min chart could be a huge bull flag forming - pole from 25/10 to 3/11 :)
 
Mom- that would make 10, 200 then?
When I said STAY OUT, I meant stay out when the figures are released on the street!!!! NOT for the whole day. Channel break and that looks to be the down leg done.Current CCI status leaves room for 100+ points to the upside, but RSI is topped out. If we are to go up, then RSI has to fall back , revealing weakness as it has to get back to the 30's/40's before it can push up.Clear cut close for the 10 min short as the 100MA AND the res line was broken around 9810.
From the bull flag perspective, this portrays a weakness seen in the 1 min charts. Notice the 3rd attempt at a low fails to meet the "expected" support line. This is a common signal saying that the bull flag will break to the upside as expected. That was coupled with PD.
BUT I hear you say, the support line only touches the price in ONE place..... that is because I favour drawing trend lines in parallel channels on a "best fit" basis. Clearly, the top resistance line has a perfect fit, so I draw the lower one parallel to it such that it "looks right ". This is a process of continual re-adjustment as the day goes on.
 

Attachments

  • dow 06-11-03 10.gif
    dow 06-11-03 10.gif
    26.6 KB · Views: 440
Top