Dow Exhaustion gap?

Bigbusiness

Experienced member
Messages
1,408
Likes
23
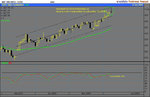
Looking at this chart I wonder if there was an exhaustion gap on the Dow on Friday?

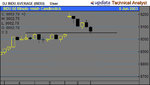
http://tinyurl.com/dpbk

The markets have had a good run recently and it seems the expectancy is for it to continue. Lots of bears have been stopped out for large losses and bulls are buying to not miss out on the new bull market. The volume last week was as high as when the market last made a major turn.

Next week could be interesting.

http://www.hardrightedge.com/wheel/hregaps2.htm
 
just looking at it, we seem to have been in an ascending wedge.With a spike being thrown out of the top. I had a ftse futures bet on but closed it friday. I think it's best as always to react rather than predict. Just be ready monday to profit from whatever presents itself?
 
Does that really qualify as a gap though? The gap shown on the chart is simply the "gap" between the closing and opening prices, and you would still have been able to buy in the "gap" price, had you gone long after thursday's close.

I thought gaps represented points in the market where stocks were exhausted at a particular price, which then causes a gap as you have to look for the next available price at which to buy your position - be that long or short.

Or am I wrong? If so I'm more than happy to be corrected by all and sundry (and doubtless will be.....) :LOL:

RR
 
rosso
1) how do you buy anything when the markets are closed ?
2) on thursday, you would not have known ther would be a gap opening on friday morning ?
 
What I mean is my broker ( as most, I understood ), allow you to take a position on the FTSE or the Dow 24/7, so you could have opened a long bet on the Dow after Thursday's close, and held onto it (assuming your 'nads are big enough if it were to go against you, of course). Hence, you'd have been in the market when it produced the gap overnight / on Friday morning, and for you there would technically have been no gap.
 
:LOL: :LOL:
thats an interesting point of view: :LOL:
:LOL: :LOL:

now all I need to do is e-mail everyone in the world
to find out if they opened a trade, so I can correct my charts ?
 
Agree Uncle,

Could be some serious profit taking next week. NB. The gap is not always necessary to qualify for a shooting star ( Nison -Japanese Candlesticks). Also not as potent as the evening star as a reversal indicator. :D
 

Attachments

  • s&p 500 index.jpg
    s&p 500 index.jpg
    467.5 KB · Views: 498
Last edited:
There was a similar day on April 7th that didn't cause a major reversal. But Friday had higher volume and was after a two month rally.

If Monday is a down day, a few bears might wish they had held on to their shorts.
 
uncle & lockstock

I agree that a reversal looks on the cards but that "reversal" can include sideways movement as well as a downward move. Opening strength will nullify the signal and be bullish.

The odds, though, favour a downward move. On FTSE several important index constituents have divergencies between rising price and falling accumulation/distribution line pointing to imminent price corrections. Don't know if this is the case for DOW constituents.

Good trading.

Jon
 
Hi guys,

I think one thing is established- we all agree there is a question mark to the upward momentum. Hanging men, shooting stars, exhaustion gaps all point to one thing. CAUTION!!

Monday the market could carry on its merry way or not, non of us know.

My guess a run up on the INDU to either 9100 or 9160 then good night Vienna a trip south.


A man who thinks the same thing at 60 as he did at 30- has wasted 30 years ! ( The Greatest)
 
Re:: A man who thinks the same thing at 60 as he did at 30- has wasted 30 years ! ( The Greatest)

Ahhhhhhh..........If only it were the other way round..........think of all the mistakes avoided!!!
 
Anyone agree/disagree with this chart ?
 

Attachments

  • dow jones.jpg
    dow jones.jpg
    124.3 KB · Views: 290
I'm sure I shall be corrected if I am wrong, but there are two sets of data for the Dow. When I was using AIQ with myTrack INDU and DJI gave slightly different data - one goes from when all 30 Dow consitituent stocks are open, the other goes from when the first one opens (I can't remember which is which though).

So that means that one shows gaps, the other does not.
 
Did the Daily gap?
You could have an island reversal if it opens down.....Powerful!
 
Top