Dow 2010

Date: 5th February 2010

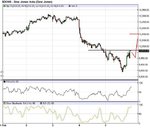
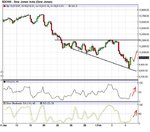
DOW reclaims 10,000........The DOW closed at 10,012 Up 10 points.........At one point the DOW was down to 9,835. It bounced off a support level from round about 4th - 5th November 2009 on my 60 day volume chart graph. There is quite alot of support volume now in the market and all my indicators are saying we are oversold. Does anyone agree?.......The DOW could bounce from here. Not saying it will but it might. I may go long............Long term I still think we are going down.


We could be entering a BEAR market.........What do you think?
 
Last edited:
Agree, for short term we can see a retracement from the last drop. 10 min chart is overbought so today we might see 9950 but after that theres a head n shoulders about to form with a 10 000 resistance level.60 min chart is oversold, a strong indication of a rise for me. market is at a volatile point and shorter term moves are more unpredictable, but i would trade the 10 000 breakout, but only when it brakes up.

And i totally agree that we are falling for long term, atleast my position is still in
 

Attachments

  • dow-0802_1.JPG
    dow-0802_1.JPG
    61.4 KB · Views: 206
  • dow_0802_2.JPG
    dow_0802_2.JPG
    69.3 KB · Views: 171
I went Long on Friday but with a very tight "stop loss". It was triggered by a fall today.......I only made £14...but still that is SIX out of SIX trades correct so far.
 
Congrats, HG.

Chode, which charting service is that?

Date: Monday 8th February 2010

DOW closed at 9,908.....down 104 points (interesting because 9,900 is a Fibonacci support level. Also there is a support level back on the 4th November 2009. It is "bang on")......Next support level after this is 9,800 and 9,750 on my charts. If we break this then the DOW is in trouble in my opinion.


Thanks Spcboe......I may be wrong here, but that spike down to 9,835 was interesting on 5th February 2010. Remember what I said in my previous post (post 29) about "Fearful Traders". Someone sold shares in a panic! The prudent traders immediately then came back in a bought shares again pushing the DOW back up to 10,012 up 177 points from the low of 9,835. Although the DOW fell 104 points today.......I think this is only profit taking from the 177 point rise. I would have taken the profit as well (would you?).....Call it intuition....I maybe wrong but I still feel there is some room to the upside. You have to be careful though going Long. I agree with Chode. He said "shorter term moves are more unpredictable" (especially going Long on the DOW at the moment). It is risky!.....but I like the risk!

Hey Spcboe and Chode.....have you tried freestockcharts.com ??? It is very good for FREE. Plenty of indicators to choose from. Let me know what you think?
 
Last edited:
just as i suspected, dow completed the pattern, broke the 10 000 and goin up. it took some time to gain strenght and now it seems not a very weak climb, i guess its going up to 150 points.
There is a very good article today about an index, that is a compilation of the "core holdings" being held by Institutional Investors. And that index has very clear patterns to show: http://www.stocktiming.com/Tuesday-DailyMarketUpdate.htm

Since im not paying for any charts and im trading using the Metatrader, it was easier to use charts from http://barchart.com/ and drew the lines using paint, just for posting them.

Thank you Holy Grail 2 for the freestockcharts, this is amazing and for free! great community we have here :)
 
Last edited:
The day is ending and the H&S finished its job.. The pattern seemed a bit sloppy, had a pullback, quite common actually. But in the end did very well, price hit 61.8 fibonacci retracement level - a good target for that pattern. nice 100 points :p
 
I decided to go "Long" yesterday on the DOW. Closed it today for a £166 profit. Take the profit when you can, I always say......That is SEVEN out of SEVEN trades correct so far. As I said, you have to anticipate the market early. Before the "horse" has "bolted"........

DATE: Tuesday 9th February 2010

DOW closed at 10,059 again reclaiming the 10,000 level. up 150 points. At one point reaching 10,138 (which is interesting because it is a resistance level back on the 9th November 2009...."bang on").......As I suspected, we were on a solid support level at 9,908 and this is why I took a "Long" position yesterday. It paid off. As I said in post 45, the 104 point drop yesterday was profit taking from the 177 point rise the previous day. More upside possible. Not sure how much though......My volume charts are saying we are hitting resistance volume with the 150 rise today. I think my next position will be "Short"........Long term I believe we are going down according to my 10 year volume charts.

Chode.....I am pleased you like freestockcharts.com...........It is amazing for FREE. LIVE charts as well on the DOW. AMAZING indicators.......
 
Date: Wednesday 10th February 2010

The DOW closed at 10,038 down 20 points. Some profit taking I think from the 150 point rise from yesterday. The "bears" pushed the DOW down to 9,963 at one point before the "bulls" pushed the DOW back up to 10,086 at one point. It is possible the "bulls" have not finished yet and may try and push the DOW back up tomorrow. I may be wrong. What do you think my friends?.......I am planning on going "short" soon. It just depends on when I feel it is the right time.
 
dow formed a symmetrical triangle withing the broadening formation and when drawing fibonacci from the high of 20th january, there was a nice sign of ye olde 50% retracement goin on, to a very clear resitance level even. it played a trick in the opening times, broke the support barrier, but quickly recovered. my short term buy trigger is still staying for sure :p... for the long term position im happy that my stop is higher than the current buy target, and if it brakes down, still good :)
 

Attachments

  • dow_1102_1.bmp
    1.3 MB · Views: 155
DATE: Thursday 11th February 2010

DOW closed at 10,144 up 106 points! At one point the DOW was down as low as 9,977 and at one point as high as 10,161

As I said in post 50.......the 20 point drop yesterday was only profit taking from the previous days 150 point rise. I also said "It is possible the "bulls" have not finished yet and may try and push the DOW back up tomorrow"........that is exactly what happened today.

I may go "Short" now on today's move as we have hit "again" a resistance level back on 9th November 2009 (bang on). Also my volume charts are indicating a peak in "resistance" volume on my 30 day and 60 day charts.


I have also noted that a sell order came in right at the end of the trading day according to my charts. Not sure if that is significant......Maybe a little profit taking tomorrow. Interestingly the DOW traded in a "tight corridor" for about the last 4 hours of trading. Either it is gearing for a move up or we have hit resistance and we are going to fall.

Difficult one to call this one........."BULLS" or "BEARS"?
 
Last edited:
HG2, is it possible for u to post a chart of the resistance volume you are speaking of?

Very good thread so far.
 
HG2, is it possible for u to post a chart of the resistance volume you are speaking of?

Very good thread so far.

Sorry Cannot at the moment as the package I used was only on a 30 day trial period. It ran out yesterday unfortunately. I am a little lost without it now......I am working on a fool proof system at the moment. It is working well so far. How are you getting on with www.freestockcharts.com.......Spcboe? Hope you like it. It is good for FREE.
 
I went "SHORT" yesterday and closed the trade today for a £58 profit......that is 8 OUT OF 8 trades correct now!
 
DATE: Friday 12th February 2010

DOW closed at 10,098 down 46 points. At one point the DOW was down as low as 9,984 in early trading.

As I said in Post 53 I suspected the "tight trading corridor" yesterday was in fact "resistance volume". I also said "I have also noted that a sell order came in right at the end of the trading day according to my charts. This was obviously significant and that is why the DOW fell today.

What next short term? I am not sure to be honest as I have lost my volume charts at this moment in time. I am relying on freestockcharts.com.........It is indicating that there is room for a move up........Long term I believe we are going down......heavy!
 
culdnt agree more. might be a little move up still. but the broadening formation that begun from the end on january is about to mature. my target would be about 9700-9600, sweet 1000 points trade :p

Holy Grail 2, care to share what service did you use for those wonderful volume charts?
 
agree...YM looking shortterm bullish to 10125

Im not sure where we are headed as of this moment. 10125 still holding on the daily (but wasnt accepted or rejected). Transport suggest a little more upside to a little over 4000(currently 3917).These are not the charts I use but i found them and pasted them instead. I dont know how to do this with THINKORSWIM

cantclosepast 10125.png

daily chart.png
 
Last edited:
Top