Re: Big picture call for a bottom
--------------------------------------------------------------------------------
Quote:
Originally Posted by breadman
big picture, I think we will make a new low this year by the end of May. If I was to pick a figure it would be somewhere around 650 on the S&P.
S&P 500 earnings for 2009 are going to come in somewhere between $40 and $45 dollars, and it might even come in at less than $40 dollars, with a p/e of 15 that would be 600/675 with a p/e of 10 that could take the S&P to 400/450 although I don't think it will go that low.
Once we hit a low in the first half this year I think we will have a 1/3 year size ways move range bound between 650 to 1100 on the S&P 500 before we make a double bottom or a new low maybe down to 400/500 on the S&P.
By the time this slow down is over I think it will go down in history as the worst recession since 1929.
The stock market falls 40/50% in most recessions but fell 90% in 1929 so I expect the bottom to be somewhere between 50% to 90% falls.
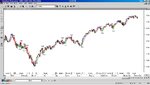
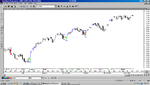
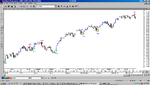
Now we have had the bounce where do we head in 2010. I expect the top to be between the 50% and 61.8% retrace levels 10350 and and 11250.I think one more leg up then we could top, the start of the year 6th of January 2010 or 14th of January 2010. If this leg of the rally is the same length as the rally from March to June the S&P500 could top around the 1160 level. the Dow has already hit it's level at 10500, but if the S&P500 goes higher so will the Dow. Looking back in history I would suggest having a look at the 1937-1942 pattern in the Dow as we could repeat a similar pattern 2007-2012, 80 years later. a top at the start of the year a correction and a double top later in the year. maybe.
breadman