You are using an out of date browser. It may not display this or other websites correctly.
You should upgrade or use an alternative browser.
You should upgrade or use an alternative browser.
Dow 2009
- Thread starter N Rothschild
- Start date
- Watchers 65
Jason Rogers
Senior member
- Messages
- 2,772
- Likes
- 93
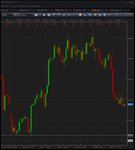
9650 will be a nice spot..
I was thinking that may actually happen at the start of the day. Wouldn't be surprised to see a move lower and close on the lows of the day.
Jason Rogers
Senior member
- Messages
- 2,772
- Likes
- 93
Nice break from the head and shoulders pattern. Looks like 9125 could be the next stop according to chart. Also trading the EUR/JPY in conjunction with this. DailyFX had a good article on the seasonality of stocks for the month of September which could cause further drop in EUR/JPY as well.
Attachments
Faisal_Danka
Newbie
- Messages
- 7
- Likes
- 0
Weakness on 10k would be a nice one to short and double up at 9000 and below.

Sonicthehedgefund
Newbie
- Messages
- 5
- Likes
- 0
Maybe a quick trip to 9000 before OPEX?
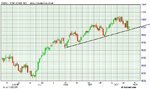
That channel is incorrect, its a rising wedge. Take the slight break out in May, with the wave highs. This could signal a reversal, could be a head fake. This wave may not break down.
Write some calls at the 10,000 level for October- :clap: Take the nice premium.
That channel is incorrect, its a rising wedge. Take the slight break out in May, with the wave highs. This could signal a reversal, could be a head fake. This wave may not break down.
Write some calls at the 10,000 level for October- :clap: Take the nice premium.
amit1986
Experienced member
- Messages
- 1,100
- Likes
- 66
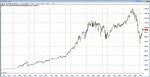
I posted this on my journal, but thought it would be more appropriate to post it here as well. Not sure if the time frame for this chart is of any use to traders here, but thought it might add some value.
The Dow Jones Industrial Average seems to be in the process of forming the right shoulder of a Head and Shoulders pattern at the moment. I didn't include any trend lines on this chart, but anyone with knowledge on this basic pattern would know what to look for.
A quick extrapolation from the chart caters to suggest that, if the pattern follows through, DOW could go to 4000 by roughly 2020? :|
Attachments
firewalker99
Legendary member
- Messages
- 6,655
- Likes
- 613
A quick extrapolation from the chart caters to suggest that, if the pattern follows through, DOW could go to 4000 by roughly 2020? :|
What's the point in speculating what's going to happen 10 years from now? It's hard enough to know what the next day could bring 🙂
pattern
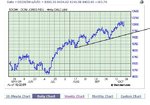
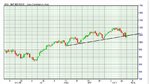
since i trade chart patterns and i had seen the bump and run pattern before the recession which came true, id like to show you another one which is very likely to brake because 10000 will be a resistance level, not support coz market wont have enough bulls yet.
since i trade chart patterns and i had seen the bump and run pattern before the recession which came true, id like to show you another one which is very likely to brake because 10000 will be a resistance level, not support coz market wont have enough bulls yet.
Attachments
Atilla
Legendary member
- Messages
- 21,114
- Likes
- 4,304
since i trade chart patterns and i had seen the bump and run pattern before the recession which came true, id like to show you another one which is very likely to brake because 10000 will be a resistance level, not support coz market wont have enough bulls yet.
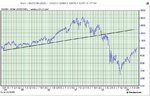
Fwiw - in my last charts I have Dow touching 10400-500 before bouncing off resistance...
KUTERO
Active member
- Messages
- 239
- Likes
- 17

Atilla
Legendary member
- Messages
- 21,114
- Likes
- 4,304
Imminant boil over soon I reckon. Negative divergence is building up.
On a FA level wondering what could be the catalyst that sets it off...

Atilla
Legendary member
- Messages
- 21,114
- Likes
- 4,304
Whilst the charts looked over bought I'm one of those cynical sods who thinks pension fund managers will boost the market to top up their bonuses and the drop will happen early next year...
Bear trap mi thinks... 🙄
I'm well confused... 🙄
Similar threads
- Replies
- 1
- Views
- 2K