Dow 2008

Status
Not open for further replies.
Breadman & Atilla... you guys are legends when it comes to technical analysis on this forum - you have predicted highs and lows and I look forward to your posts. Having said that, this is all technical analysis - the fundamental issue is that there is no reason for the market to go up to 13000 or even 12000 now. Before, it was a case of oil dropping to $100 pushing the markets up. Even that has not happened.

There are rumours of a european bank collapsing soon - basically, the future looks gloomy.. although I do hope you are right about 13000!
 
In the Nasdaq index, a new low was put in @ 1705.

Markets are up currently, but I am short! Yikes! Today's gain seems a little artificial, so I expect some of the gains to be erased. Looks like the Dow rallied but gave back some of those gains.

I say we head lower before we pop back up to 13 on the dow and 1700 on the nasdaq (at least) before we pop. The rules are constantly changing and systems are being modified it seems. OIL relationship is long gone for now...
 
that's as long as we don't have a higher low now with a rally which goes higher than 11860, before we turn back down.


Breadman, do you think 11/12th September as you predicted from last month the reason for this sudden upswing?

Firewalker as much as I was a bear I'm really unsure aout this next move.

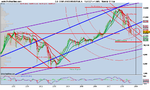
On this chart created on Nov 07 based on previous turn in 2000-03, the Fibonaci first arc is acting as some pretty strong level of support. I can also see the higher low so coupled with the two red S&R lines based on same magnitude as previous falls is the reason why I feel next wave is an upwards move. Purely based on TA S&R off this chart. Charts showing 12300 by end of the year but I reckon with some hype 13000s on the cards. Perhaps another lower high around December. Our poor fund managers must get their bonuses or the World might well cave in. :cheesy:

The red circle was where I was expecting the indeces originally but the falls have been much more rapid and breakdown quicker than I thought. Might still happen but who knows.

I am also looking over my shoulder and can also see H&S formation and if the falls do take place then 10500 is also visible. Even 10,000 which is the ultimate support line I have based once again on previous falls.

In summary, I think the red S&R lines will hold and I expect a move up for these reasons.

I would like to see this consolidation/congestion work it self out of the system first so we can see where we are heading next.

Previously, I would place trades in the morning or evening before setting off to/from work and I would make gains or get stopped out. Last week or two it was all stops and no gains. Hence, I have learnt my system works sometimes and fails at others. That's MAs for you dohh... :eek:

Good trading everyone. (y)
 

Attachments

  • DOW JONES INDUSTRIAL A-20080911-W.png
    DOW JONES INDUSTRIAL A-20080911-W.png
    32.1 KB · Views: 151
Waves on the Beach

Sometimes I look at the charts and I see great art (maybe I have been staring at the screens too long). The attached image of the DJIA reminds me of waves rolling in on the beach. Waves. Elliott Waves?

And what was with that rally at the end of the day? Shorts unloading? I bought Puts at the top (15:13 EST) expecting a crash but I had to unload them when it came back up (whew - I even made $10 after commish). Indicies for the day are all up but all indicators for market breadth are down. Bullish % was flat for the S&P 500 but Negative and continuing to fall on the NYSE and NASDAQ. Is this rally sustainable?

I myself remain quite Bearish but I am always doubtful of my position. Any comments or forecasts on further market action are quite welcome.

Z.Z.
 

Attachments

  • waves on the beach.bmp
    3 MB · Views: 129
Breadman, do you think 11/12th September as you predicted from last month the reason for this sudden upswing?

Atilla,
these cycles dates I post have a better than average chance of catching highs or lows within a couple of days, so I think this should hold until we get higher prices.I don't know if it will get to your price target of around 13000. My best guess at the moment would be 12075 on the dow and 1331 on the s&p and then check the picture from their.
We have had a outside day yesterday and a higher low, so that is bullish, we will just have to wait and see now.
 
I got this in the post today from ADVFN

" In 1976 our leaders took our country to the brink
of bankruptcy. Well guess what...


Britain's going
bust AGAIN!


32 years later and the Establishment has cocked up again.
And it threatens the wealth of every UK investor.

Act on the information in this report IMMEDIATELY
and you could protect yourself before it's too late. "

I think its prob a down day today
 
Higher interest rate or tax rate for the US/ UK

In fact, to simply put, the rest of those who are still in employment will be facing more tax to pay for those who got into unemployment and cannot service their mortgage and other loans!

In the UK, he inflation rate would also rise and therefore the Gov of the Bank of England might be pressed to increat the Base Interest rate to more than 6 per cent!

Well, the picture is grim really - oil production is due to fall as well due to the supply ( natural supply depletion rate being too high ) and thus the price of oil will shoot up for consumers again!


S K

On a fundamental level this is BIG BAD NEWS.

Somebody has to service that debt. We are looking at;

1. Tax rises or
2. Interest rate rises

to balance the books. Typically, I don't think this important piece of what comes next has been built into the rises.

Having said all that I still see the DOW at 13000 by end of year. Time will tell... :whistling
 
In fact, to simply put, the rest of those who are still in employment will be facing more tax to pay for those who got into unemployment and cannot service their mortgage and other loans!

In the UK, he inflation rate would also rise and therefore the Gov of the Bank of England might be pressed to increat the Base Interest rate to more than 6 per cent!

Well, the picture is grim really - oil production is due to fall as well due to the supply ( natural supply depletion rate being too high ) and thus the price of oil will shoot up for consumers again!


S K

So I assume you are Long oil and Short indices, also Short the GBP. Is this the position you have or are you just spouting your opinion of doom and gloom to drum up business? I'm intrigued.
 
There is a rumour of 1/4 rate cut. The rumour hit the market late afternoon yesterday , while the rumour is around market will be very volatile.

Be careful

Grey1
 
There is a rumour of 1/4 rate cut. The rumour hit the market late afternoon yesterday , while the rumour is around market will be very volatile.

Be careful

Grey1

We talking US or UK here?
 
Rate Cut?

The Fed Funds Rate follows the 3-Month T-Bill Nominal Yield.
Fed Funds Rate: 2.00
3-Month T-Bill Yield on 080910: 1.65

Hmmm....

Z.Z.
 
This is the problem with the DOW at the mo. Very difficult to decipher.

I reckon pick a best fit line through the middle and just AC/DC it...

No rudder, no compass, up sheet creak without a paddle, which way is the wind blowing... :cheesy:
 
This is where the patient triumph and the over active fail

um umpty um um

:whistle:whistling
 
Fed Funds Rate to be cut?

I am worried about a Fed Funds rate cut over the w.e. (I am bearish)

3 month T-Bill yield continues to drop... now 1.40 vs a funds rate of 2.00
 
I took today off as it seemed to just Chop Chop Chop around!
I hate days like today, although there were a few good setups.

I shorted the GBP the other day...big free fall drop, it was pretty nice.
Eventually oil will make another run up, if the saudis decide to cut back production.
 
Status
Not open for further replies.
Top