Atilla
Legendary member
- Messages
- 21,115
- Likes
- 4,305
Hi everyone,
My last weeks stab at analysis with the EW took me no where. Best left to the professionals I think... 😱
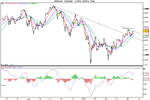
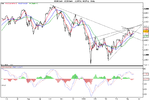
I do feel though we are still at the same place and are only treading water. The DOW looks like desparately trying to break out of 13200 and failing miserably imo.
I can also see some form of rising wedge and having read up on it this looks like being a very bearish sign.
My charts don't have volume but if we do have falling volume then a 35% fall has about 17 out of 19 chances of occurring according to Bulkowski.
Still very bearish and an article suggesting High St banks are set to apply for £90bn of Treasury Bills - double the £50bn touted by the BofE has scared me.
I think this is possible as I recall Bernanke stating a $100bn dollar hit from the sub-prime loan losses last year and more recently that has been revised upwards to a $1 trillion.
I also feel talk of stagflation and continued price rises are aggraviting the situ.
Basically, the charts and the news are joining ranks to signal a severe turn down imo. Not to mention the summer lack lustre period in the markets.
Hence, I'm looking for short positions. No change there... 👍
If anybody can post some charts with daily volumes that would be appreciated.
Good trading everyone. :clover:
My last weeks stab at analysis with the EW took me no where. Best left to the professionals I think... 😱
I do feel though we are still at the same place and are only treading water. The DOW looks like desparately trying to break out of 13200 and failing miserably imo.
I can also see some form of rising wedge and having read up on it this looks like being a very bearish sign.
My charts don't have volume but if we do have falling volume then a 35% fall has about 17 out of 19 chances of occurring according to Bulkowski.
Still very bearish and an article suggesting High St banks are set to apply for £90bn of Treasury Bills - double the £50bn touted by the BofE has scared me.
I think this is possible as I recall Bernanke stating a $100bn dollar hit from the sub-prime loan losses last year and more recently that has been revised upwards to a $1 trillion.
I also feel talk of stagflation and continued price rises are aggraviting the situ.
Basically, the charts and the news are joining ranks to signal a severe turn down imo. Not to mention the summer lack lustre period in the markets.
Hence, I'm looking for short positions. No change there... 👍
If anybody can post some charts with daily volumes that would be appreciated.
Good trading everyone. :clover: