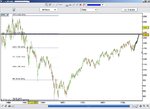
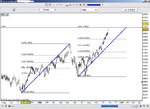
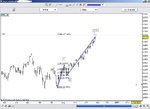
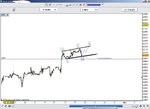
Dow 2006

And this is what James Fergusson has to say about the housing slow down in the states:

The housing collapse will clobber spending

Even ignoring the inevitable knock-on consequences for the rest of the economy (what economists call the multiplier effects) such a fall in housing starts would be equivalent to about a $260bn drop in expenditure. So where could this shortfall be made up, in order to avoid the otherwise likely slowdown to recession?

The government sector can’t do it and there are no new tax cut programmes to look forward to. Corporate investment, as we’ve discussed before, is failing to deliver the growth. That leaves just the international sector. The way this usually happens is that the enormous trade deficit will have to reverse, either by the US exporting much more (this avenue sort of implicitly includes a big drop in the dollar) or by the US importing much less (which is a demand recession).

I don’t want to say that the disaster scenario is inevitable, since Bernanke has plenty of interest rate-cutting potential up his sleeve. But it does seem amazing that there’s so much complacency about.

One illustration of how relaxed the markets are is that the VIX put/call index shows premiums below 11%, compared to a 17-year range of 9% to 44%. The VIX is a measure of the volatility of the prices of options on the S&P500 and thus measures how nervous investors are – lower numbers show calm complacency and higher numbers reflect panic. Just four months ago at the time of the global sell-off, the VIX shot up as high as 24%.
 
The spike fired off all TA traders orders at and just above the larger 78.6% fibbo combined with a lesser measured move target.

Some one played a blinder just by knowing how much size would be needed on a quiet sunday evening to trigger the lot...Hats of to them :) )
 
Pat494 said:
waiting waiting WAIting WAITING
That's the hardest to do !!
It will suddenly fall when most of us have nodded off from boredom
And is likely to be so quick as to have dropped a lot before mr average Joe can jump aboard
Patient watching is the key imho and keep awake
Bit like trench warfare
Agreed. I closed my 'cheeky long when we crossed 12100. In hindsight that was a bit early :(
I'm out for now until the inevitable correction.
 
The Cash chart still needs to print the key 78.6 and Measured move tragets....


So the traders have the clear line in the sand for the Fed...either take out the key 1383-6 area with a wide spread or it then becomes a techincal sell.

Same on the INDU with its impluse Measured Move traget .
 

Attachments

  • spx.JPG
    spx.JPG
    88.8 KB · Views: 179
  • indu.JPG
    indu.JPG
    105.4 KB · Views: 215
Love those charts Bez I'm a great fan and convert to these harmonic patterns. There's one problem though with your AB=CD, the CD leg is parabolic with no sign of retracing once they go this way the pull back could be swift and have this tendancy to overshoot as it becomes hard to control the panic when the selling starts. As a test I applied harmonic patterns to the Dow weekly and they were incredibly harmonic during the period above apart from this leg (C=D) as I say it has gone parabolic. From my calculations a normal harmonic pattern would give you the 12200 top in February 2007 (not this week!) and a retracement of 0.618 to approx 11187 (slightly more than 0.618 but less than 0.786) end of April 2007. This is an excellent example of just how dangerous the markets are looking as your pattern is the correct path of a normal market.
 
easytimes said:
Love those charts Bez I'm a great fan and convert to these harmonic patterns. There's one problem though with your AB=CD, the CD leg is parabolic with no sign of retracing once they go this way the pull back could be swift and have this tendancy to overshoot as it becomes hard to control the panic when the selling starts.

Thanks ! :eek: :)

The INDU move up from the July lows "feels" like a zig-zag W1 of an Ending Diagonal which would very much fit with a swift sharp correction into the W2.

For those who are not hard core wavers :)))
ED's
http://www.elliottwave.com/tutorial/lesson3/3-1.htm
 

Attachments

  • ed.JPG
    ed.JPG
    80.5 KB · Views: 192
Last edited:
Well we are entering an interesting phase at the moment. A correction is overdue but can the PPT keep the market at these elevated levels until Nov 7th or will they run out of steam and succumb to market pressure before then ?

Todays FOMC meeting may be another rate hike pause damp squibb but it is still capable of being a catalyst for a trend reversal depending upon what is said aswell as what may or may not be done. It could still be a little premature but I opened a tentative short on the NDX at 1733 (Dec) yesterday after the SOXX broke through support at 450. Will add to this if breaks the next level of December support at 1707.

Looking for the Dow to firmly break through 12000 on the Cash markets before going short there.
Could be volatile at around 19.00 today !
 
HOUSING IN U.S. POISED TO WORSEN, DERIVATIVES SHOW
By Darrell Hassler and Hamish Risk

Oct. 23 (Bloomberg) -- The slumping U.S. housing market is about to get a lot worse, according to traders of mortgage-backed securities and the so-called derivatives on which they are based. The ABX index, which measures the risk of owning bonds backed by home-loans to people with poor credit, rose 30 percent since Aug. 9 to the highest since January. There are more than $500 billion of such notes outstanding. The increase in the index shows traders expect mortgage delinquencies and foreclosures to increase at a time when the number of homes for sale as measured by the National Association of Realtors is at a 13-year high. The percentage of home-loan payments more than 60 days delinquent rose to 7.23 percent in July from 5.9 percent a year earlier, the fastest rate of increase since 1998, Moody's Investors Service said Oct. 17. "Delinquency trends and home prices'' show a weakening real estate market, said Scott Eichel, head of credit trading for New York-based Bear Stearns & Co., the biggest underwriter of bonds backed by mortgages. "A lot of investors that have concerns about the housing market' are using the ABX index to speculate on a continued drop" he said. Sales of new and existing homes probably will drop 9.4 percent to 6.76 million in 2006 from a record last year, McLean, Virginia-based mortgage buyer Freddie Mac said Oct. 10. Home sales have risen the past five years.

The ABX index, created by London-based Markit Group Ltd., measures the cost, or spread, of credit-default swaps based on the $565 billion of bonds secured by so-called subprime mortgages and home-equity loans. Credit-default swaps are financial instruments based on bonds and loans that are used to speculate on the ability of borrowers to repay debt. An increase in the spread indicates deterioration in the perception of credit quality; a decline suggests improvement. The index tracks 20 asset-backed securities that contain loans rated BBB-, the lowest level of investment grade debt. Based on the index, it costs an investor $267,000 to protect $10 million of bonds against default for five years, up from $205,000 in August. The investor would get face value for the bonds in exchange for the securities should a borrower fail to adhere to the debt agreements. "The unequivocally bad housing data we've seen is prompting investors to seek to profit from potential declines in mortgage-backed securities", said Greg Lippmann, the head of asset-backed trading at Deutsche Bank AG in New York who helped create the ABX indexes in January. Contracts covering $5 billion of home-loan debt change hands daily, he said. Derivatives are contracts whose value is derived from stocks, bonds, loans, currencies and commodities, or linked to specific events such as changes in interest rates or the weather. The housing boom spawned new types of mortgages that allowed consumers to buy homes they may not have been able to afford otherwise. About 18 percent of all mortgages issued in the first half of the year were to borrowers considered most likely to default, such as those with high credit-card balances, up from 2.4 percent in 1998, based on data from the Mortgage Bankers Association. The Washington-based trade group's 2,700 members represent 70 percent of the home-loan business. The amount of bonds backed by subprime loans more than doubled since 2001, according to the Bond Market Association, a New York-based trade group of more than 200 securities firms.

A Merrill Lynch & Co. index of debt securities derived from home-equity loans rated AA to BBB is having its worst month this year, falling 0.01 percent. They have returned 4.54 percent since the end of December. Banks and lenders such as Countrywide Financial Corp. in Calabasas, California, and Washington Mutual Inc. of Seattle typically take mortgages and package them into bonds for sale to investors. The bonds are then divided into pieces of varying risk. All asset-backed securities, which also includes loans packaged from credit-card and student debt, have returned 4.27 percent this year on average. More borrowers are finding it harder to meet interest payments following 17 interest-rate increases by the Federal Reserve since mid-2004. The default rate for subprime loans rose to 7.35 percent in July from 5.51 percent a year earlier, according to investment bank Friedman Billings Ramsey Group Inc. in Arlington Virginia. Nine percent of all subprime loans made in 2006 may default within five years, the worst performance since at least 1998, Glenn Schultz, head of asset-backed securities at Charlotte, North Carolina-based Wachovia Corp., said in an Oct. 17 report.
 
Anyone fancy up to 12170 ish before dropping back again as Jilly suggests ?
 
YOOOOOOOOOOHOOOOOOOOOO

anyone out there ??????

Better not mention bearskin rugs for Christmas presents !
Might get the sulks big time LOL
 
Pat494 said:
YOOOOOOOOOOHOOOOOOOOOO

anyone out there ??????

Better not mention bearskin rugs for Christmas presents !
Might get the sulks big time LOL

I'm holding a long from the dip just after the open - stop just below yesterday low - will be out b4 the news and would be happy with 40 points......62 all the better...

PS - who's Jilly??
 
Gap Man said:
I'm holding a long from the dip just after the open - stop just below yesterday low - will be out b4 the news and would be happy with 40 points......62 all the better...

PS - who's Jilly??

Great to hear from you
JillyB does a daily Dow journal with about 80% success record.
Bottom right of Home page
She's ontrack today too
 
Last edited:
Those barmy "random" pattern Bez charts, seem to hint at what Jilly is looking for as well....:eek:: :)))
 
Bez said:
Those barmy "random" pattern Bez charts, seem to hint at what Jilly is looking for as well....:eek:: :)))

Perhaps you would like to post a chart here ? Anything like tea leaves ?
 
Posted a few charts on the last page but here's a an intraday doodle that i'm leaning with for now :eek:

with some clear lines in the sand on it....
 

Attachments

  • indu-intraED.JPG
    indu-intraED.JPG
    75.4 KB · Views: 184
Big SOXX 2.5% bounce back today. NDX has also moved back up 0.5%, mainly on the back of Amazon +11.5% and KLAC + 9.5%, but otherwise todays rally seems to lack any real substance.
 
Top