dc2000 said:I'll give that a shot for fun 11014 high 10895 low 11023 high
Hi Dc I've done a range for Monday-- High 11031 Low 10930 Range 101
Another option Hi 11100-----Lo 10990
dc2000 said:I'll give that a shot for fun 11014 high 10895 low 11023 high
Matt321 said:Found a new formula to predict next days range on previous days OHLC.
Today Range is 91 High 11048 Low 10957. Its only rough guide.
Todays Pivot 11027
Pat494 said:Hi Matt,
Just to compare the "ordinary" pivot point calculation with yours- for Monday it is :-
Higher 11173
High 11081
PPoint 11007
Low 10915
Lower 10841
Personally I have found that barring overriding factors it will initially head for the pivot point near to the opening before going its own way.
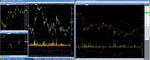
frugi said:Today's low on the Dow. Sellers dry up with a bullish Tick divergence on an obvious higher TF trend line ...
frugi said:Today's low on the Dow. Sellers dry up with a bullish Tick divergence on an obvious higher TF trend line ...
:cheesy: :cheesy: 😆dc2000 said:The "have a nice day" indicator
similar to the Vulcan "live long and prosper"
or "pull the ladder up Jack Im alright"
Ive lead a varied life or perhaps I should seek medical attention
Phase 2 = ?DepthTangent said:Looks like "phase 2" is well on its way.