Does trend Following Work on Stocks....

What a great read, thanks.

1000+ signals a year is a bit much though. What filters could be used to bring that down to a more reasonable amount? p/e ratio?

Also the effect of dividens is stressed in the article, how do dividens work with respect to derivatives like options and spread betting?
 
Interesting paper. One way to cut the numbers down would be to do the scan on UK stocks rather than US. I can't see why the outcome would be hugely different. Alternatively, focus on a particular market cap range.

I'm not surprised by the conclusion: I can see the reasons why stocks trend at least as strongly as forex, commodities, etc, particularly the small- or mid-caps where it takes a while for a 'story' to gather momentum as more and more fund managers jump on board and the whole thing starts rolling, while at the fundamental level it starts delivering the growth which ratchets down the p/e each year.
 
What a great read, thanks.

1000+ signals a year is a bit much though. What filters could be used to bring that down to a more reasonable amount? p/e ratio?

Also the effect of dividens is stressed in the article, how do dividens work with respect to derivatives like options and spread betting?


max,

dividends are priced into the spreadbet quote, so you'll still get the benefit.

You could filter down the list by screening for those with earnings growth, for a starter.

Cheers,
UTB
 
With regards to filters, personally if I were using this strategy I would "attempt" to reduce my risk a little by filtering out shares with very high ATR's. Understandably this may affect the profitability of the system, but without backtesting I couldn't be sure.
 
As with most (all?) academic studies of this sort, it leaves out some of the more important -- some would say essential -- points, such as where is the stock in its ongoing trend of ever-higher highs. If it's over-extended, you have a problem. If it's just made a new high after having emerged from an accumulative base, then the odds on your side are much better.

Db

Have to agree. Their entry criteria is somewhat simplistic. I wonder what the results of this study would have been if they identified a trend and then entered only when it retraced to an important support area such as the 20/50sma ?

Done any work in this area DB ?
 
Last edited:
Have to agree. Their entry criteria is somewhat simplistic. I wonder what the results of this study would have been if they identified a trend and then entered only when it retraced to an important support area such as the 20/50sma ?

Done any work in this area DB ?

As far as a statistical study, no. Never felt any need to once I understood the nature of accumulation and distribution and support and resistance (and demand/supply, etc, etc).

The problem with studies of this sort as applied to the markets is that criteria have to be so narrowly defined that the results, even if positive, are next to impossible to apply to one's trading. For instance, "buy new highs" makes some sense, but unless one is going to buy the entire universe of stocks that made new highs yesterday, he is going to have to pick and choose, and that's where the stick gets thrust into the spokes.

As for moving averages, they don't provide support in and of themselves, but that's another subject. Your point about trading off support -- i.e., real honest-to-god support -- is sound.

Db
 
As for moving averages, they don't provide support in and of themselves, but that's another subject.

I've never been able to get my head around the idea of using moving averages as meaningful trade signals or support/resistance. They are simple statistical constructs with no real meaning whatsoever. Of course, the fact that so many traders focus on them produces makes them meaningful at times.
 
With regards to filters, personally if I were using this strategy I would "attempt" to reduce my risk a little by filtering out shares with very high ATR's

Why do you feel the need to do this ? If you position size correctly it should not make too much difference.


Paul
 
Why do you feel the need to do this ? If you position size correctly it should not make too much difference.


Paul

I agree. ATR is just a measure of price movement. You can easily adjust your position sizes to equalize the tick value of trades on stocks with different ATRs.

Furthermore, the base ATR calculation doesn't really provide a good idea of comparative price risk since higher priced stocks are generally going to have higher ATRs, even if their price moves are somewhat smaller in % terms.
 
As far as a statistical study, no. Never felt any need to once I understood the nature of accumulation and distribution and support and resistance (and demand/supply, etc, etc).

Db

For signs of accumulation would you just be looking for a level chart? Does volume give anything away?

Cheers

Max
 
For signs of accumulation would you just be looking for a level chart? Does volume give anything away?
Yes. Accumulation does require building a stack without raising the price against your buying campaign and that will show itself ideally as consolidation with low and level volume.

Any occasional rise in price is brought back down by sufficient selling to normalise the price level, but on balance , they’ll be buying more than they’re selling.
 
Any occasional rise in price is brought back down by sufficient selling to normalise the price level, but on balance , they’ll be buying more than they’re selling.

Tony,

why couldn't the same be said for distribution - ie why would hat scenario not apply in the opposite direction? Silly question no doubt.......?

UTB
 
Trend following works on anything as long as you can recognise who's trend you are following .
 
Tony,

why couldn't the same be said for distribution - ie why would hat scenario not apply in the opposite direction? Silly question no doubt.......?
It could be said, in theory, but doesn't work that way in practise.

Distribution normally occurs into weak buying - the crowd excitation phase on the final bull stage of the trend. The tell-tale sign is the final day/bar of the transfer from strong to weak hands in the enormous relative volume, but relatively narrow range. Where did all the effort go? LOL.
 
For signs of accumulation would you just be looking for a level chart? Does volume give anything away?

Cheers

Max

A "level" chart, yes, and volume gives a a great deal away, if one understands what accumulation is all about. Those who are accumulating whatever want to accumulate as much as possible at as low a price as possible. They can't do that if price is in a continuing upward creep, so they make every effort to keep price in a relatively tight range. Eventually, though, the ease with which price moves out of the base after accumulation is done is an indication of how successful the accumulation was, i.e., everyone who wanted to sell has sold, so there's no longer any significant resistance to the buying pressure.

Db
 
Is the study of volume restricted to individual stocks? Looking at the volume data supplied by yahoo for the nasdaq index is just plain confusing. I can't seem to recognise any patterns. Do I just need to learn how to read it?

What I understand about volume so far:

1: Increased volume confirms the price action - to a point.
2: Extrememly high volume especially after a trend is a blow off and indicates a reversal is about to happen as there are no more buyers/sellers.
3: Low volume within small range is accumulation.

I can't make head nor tales of it on the index though!

Cheers

Max
 
Max, not quite as cut & dried as that. The context within which the price action (H, L and C) and Volume develops is absolutely integral to any decent attempt at assessing the probabilities of what’s likely been happening, is happening and what options are more than likely to happen next. Where the close occurs on the bar gives a few clues. Looking at single bars in isolation isn’t going to do it. Neither is jut looking at the Volume OR the price action – they have to be viewed together and within the context of what’s been happening to the left. Quite a way to the left actually.

Checkout Volume Spread Analysis as a start point. Either on here of just Google it. It’ll lay the foundations.
 
Is the study of volume restricted to individual stocks? Looking at the volume data supplied by yahoo for the nasdaq index is just plain confusing. I can't seem to recognise any patterns. Do I just need to learn how to read it?

What I understand about volume so far:

1: Increased volume confirms the price action - to a point.
2: Extrememly high volume especially after a trend is a blow off and indicates a reversal is about to happen as there are no more buyers/sellers.
3: Low volume within small range is accumulation.

I can't make head nor tales of it on the index though!

Cheers

Max

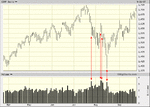
You won't get the variability in an index, but you can still use what you know about volume to interpret the trader behavior at extremes.

Look for out-of-the-ordinary volume. Here, for example, the first such bar shows that buyers are beginning to put on the brakes (note the close). The second comes during the rally attempt, and buyers are still in charge (again, note the close). The third shows that the muscle has switched to sellers (and, again, the close). The fourth shows that selling pressure has been alleviated, partly due to the lower volume and partly due to where the index closes.

You could try to make something out of all the other bars, but you will likely find that trying to find something that may not be there doesn't pay. Focus on the extreme events. If you miss them, look to enter on retracements. (And always review what's going on in the other major indices at the same time.)

Db

attachment.php


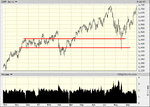
And incidentally, if you're wondering where you'd get the courage to "buy the bottom", note here that you're really only buying a bounce off support:

attachment.php
 

Attachments

  • comp.gif
    comp.gif
    25.8 KB · Views: 1,022
  • comp2.gif
    comp2.gif
    23.9 KB · Views: 1,014
Last edited:
Top