Do your research before placing a trade!

Jetheat

Active member
Messages
175
Likes
0
Pure Charting Analysis

I reckon it's a good idea to know as much as possible and obtain all the facts before placing a trade.
Plot everything you can so you make an informed decision as you pull the trigger.

I like to do that research without any indicators and I base it on price action.

Of course, I'm not right 100% of the time but at least you have some direction when you spend a little time before you start trading.

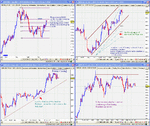
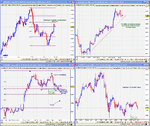
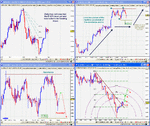
Below, are the Euro and GBP charts for which I have done what I thought would be a good forecast.
 

Attachments

  • rt1.gif
    rt1.gif
    87.4 KB · Views: 769
  • rt2.gif
    rt2.gif
    84.3 KB · Views: 607
Last edited:
Hi Jetheat, nice charts
I see you are using 76.4% as a fib level, i always use 78.6%
The square root of .618 is .786 (78.6%), another Fibonacci number used frequently
 
Camelot, Yes you are right.
I never noticed that as I don't use that level much.
It came preprogrammed into the VT platform so I just assumed it was all set and correct.

I'll have to go and change that.
Thanks for your input.

JH
 
Feb 25th

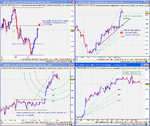
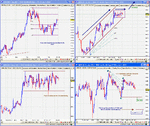
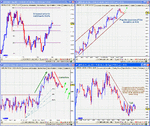
Here is what I see for the 25th. Anyone disagree or see anything different or anything I don't see?
 

Attachments

  • rt3.gif
    rt3.gif
    84.1 KB · Views: 480
  • rt4.gif
    rt4.gif
    89.9 KB · Views: 474
The charts display fine on my screen. You'll no doubt find that if you move the mouse cursor over them, it changes to a magnifying glass symbol, which, when zoomed, shows the chart clearly.
 
Nextgen, it's just normal price movement. It happens all the time. First the move is in one direction, then sideways and then it resumes its original direction.
Doesn't always work but that's what basic theory suggests.

Rossored, I don't see a magnifying glass symbol and my charts are still squashed.
When I click on the thumbnails in my post, it opens a new window which shows squashed charts. Am I the only one to see it this way?
 
It's ok now, I found the magnifying symbol on the bottom right of the screen. It appears after a short delay on my PC.

JH
 
Jetheat, I think your basic theory works sometimes, but how to explain turnaround situation? the question is: how to determine it will turn around or not.

No doubt cable MACD supports continue upward direction, but many traders looking downward movement as well.
 
Nextgen, If we knew when currency would turn around, we would be billionaires. :)

The thing to note is, if you have no valid/good reason to do otherwise, stick with the theory. Nobody knows if it will turn around at a given point. Of course, there are tell-tale signs which tell you "if you enter this trade, price will go against you soon afterwards". The way to combat this is to use Mechanical Discretion (MD).
You simply use the research you have done (before placing a trade) to judge if taking that trade is going to turn around as soon as you've pulled the trigger. Don't you normally find that you enter a trade and you see yourself making 5 pips when suddenly it turns around and gives you a 20 pip loss? It's all about knowing when and how to read these tell-tale signs.

MD is a long subject and If you want to know more about applying MD, email me.

JH
 
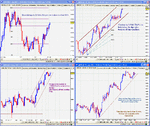
Analysis for 28th Feb

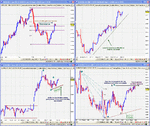
This is what I see today.

Anyone see different?
 

Attachments

  • 2802052.gif
    2802052.gif
    89.6 KB · Views: 276
  • 2802051.gif
    2802051.gif
    87.6 KB · Views: 332
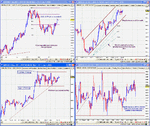
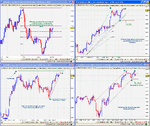
Here is what I see on the 1st of March

Anyone disagree or see anything different?
 

Attachments

  • rt1.gif
    rt1.gif
    94.5 KB · Views: 266
  • rt2.gif
    rt2.gif
    93 KB · Views: 182
Hi Jetheat,

Thanks for your postings - I love'em. I've never understood how to read the fib fan and arcs - could you give a quick lesson?

HG
 
Fib Primer

Hopefully, the information below can help.

There is a lot of history to fibonacci and ther are plenty of books which explain how it came about.
I won't bother with all that. Instead, I'll just post the stuff you need to know

On your platform, select the fib tool.
Use this tool by dragging it from the most recent highest point to the most recent lowest point or vice versa. In other words, a large swing.
The place which you start dragging is A and the the place where you stop dragging is B.

After you have stopped dragging and have released the mouse button, your platform will plot several lines in between your A and B points. These are the fibonacci levels and show the fib projections.

Consider A to B as 100%. The levels in between show a percentage of that 100%. The most important levels are 38.2%, 50%, 61.8% and 78.6%. 61.8% is considered to be the most reliable one.

In theory, the price should retrace from B to one of these levels and then bounce off. On the odd occasion, it does continue through without stopping but more often than not, it will bounce enough for you to make a trade.

So, if you know it will bounce off one of these important levels, how can you use this information to your advantage?

See if you can figure this one out. Think about using some of the MD methods to trade the bounce off a fib level.

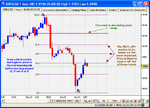
For a better explanation of this primer, have a look at the following charts:

btw, the 78.6% level has been incorrectly drawn as the 76.4 level.

I'm sure my explanations are fairly inadequate so if you have any further questions, don't be shy, post it here :D

A better explanation of the fib primer has been given at the MD forum
 

Attachments

  • fib1.gif
    fib1.gif
    24.7 KB · Views: 262
  • fib2.gif
    fib2.gif
    22.6 KB · Views: 279
Hi jetheat,

Thanks for taking the time to post that. I'm comfortable and very familiar with using fibo retracement levels - been doing this for years. It is the fibo fans and arcs that are I have never understood how to use. I've yet to see a book talk about those. I see you post them every so often on your charts so I thought you must have an understanding of how to use them.

I think you said previously that you use veritrader, who do you use to provide you with FOREX data?

By the way, what is the "MD forum' ?

Sorry for all the off topic questions...

HG
 
Hi s-a,
To the best of my knowledge, the arc and angled fibs are exactly the same as the regular fib.
However, with the arc fib, you should also plot the regular fib and where they intersect, that is where you can expect a retracement.

I haven't read anything about the arcs but by asking aroundm this is what I have gathered. Hopefully someone can correct me if I'm wrong.

I use VT (never heard of veritrader) which is the charting platform provided by CMS. They can found at www.cms-forex.com

MD forum is where everyone discusses a method called Mechanical Discretion to trade.

Since I wrote the book on the subject, I don't want to mention anything here.
If you want to learn and read more about it, see this thread

If you have any more questions, don't hesitate to ask as we are all here to learn.
 
Top