You are using an out of date browser. It may not display this or other websites correctly.
You should upgrade or use an alternative browser.
You should upgrade or use an alternative browser.
Simon, Yes actually I looked at this briefly a while ago
and coded some of the equations at the time.
Certainly the results are better than what you might
get from other indicators.
I have the book and have her papers but dont currently
have the time to devote to studying in the greater detail
that I would like, which, I plan to do soon in the near future... 😉
Regards,
Imran
madasafish
Well-known member
- Messages
- 470
- Likes
- 5
Well having reread the thread and retested my set up, I have set up a scan to run in 5 minutes with the the following logic:
ADX >30 (14,3)
CL <KELNER lower (20ema, 2.5std devs)
CMF>CMF.1 (10ma,3 smoothing)
OR
CL>KELNER uppper
and
CMF>CMF.1
and ran in a 1 minute DAX chart with a white flag showing the signal
(yes I know the logic says buy/sell when the next bar reverses the direction but I wanted just to see when it triggered)
It triggered at approx 08.15am on DAX futures this am at 3552.5 and I then had a buy signal at 3556 (all in 1 minute chart) As I write at 9.03am DAX is now at 3590.25.. a gain of 34 points..
I'm impressed and have added to my scans:
IRT logic as follows:
MPD>30 and( MPD#1>MPD#1.1 and CL<MPD#2) OR(MPD#1<MPD#1.1 and CL>MPD#3)/*5 minute ADX>30 and either close is below Keltner 2.5deviation lower band and CMF is rising or vice versa
MPD is 5 minute ADX
MPD#1 is CMF
MPD#2 Is Keltner Lower
MPD#3 is Keltner Upper
Chart is attached to next post
madasafish
Well-known member
- Messages
- 470
- Likes
- 5
madasafish
Well-known member
- Messages
- 470
- Likes
- 5
I'm afraid a gremlin has altered my scan:
it should read
MPD>30 and( MPD#1>MPD#1.1 and CL<MPD#2) OR(MPD#1<MPD#1.1 and CL>MPD#3)
it should read
MPD>30 and( MPD#1>MPD#1.1 and CL<MPD#2) OR(MPD#1<MPD#1.1 and CL>MPD#3)
madasafish
Well-known member
- Messages
- 470
- Likes
- 5
Hmm Its doing something wrong : I rewrote it correctly but one of the characters must interfere with the board's posting logic
MPD>30 and( MPD#1>MPD#1.1 and CL lessthanMPD#2)
OR(MPD#1less than MPD#1.1 and CL>MPD#3)
the logical character "less than" which is "<" does not appear to show
MPD>30 and( MPD#1>MPD#1.1 and CL lessthanMPD#2)
OR(MPD#1less than MPD#1.1 and CL>MPD#3)
the logical character "less than" which is "<" does not appear to show
madasafish
Well-known member
- Messages
- 470
- Likes
- 5
I'm using Linnsoft's IRT
www.Linnsoft.com
www.Linnsoft.com
madasafish
Well-known member
- Messages
- 470
- Likes
- 5
Another one on DAX today: Flag on white shown in top LHS of 2 min chart at 3568.approx 11.15am. DXA susbsequently fell (no higher his) to 3532 at 15.31.. 36points...3572 was spike at high at divergence so a short at 3568 and a 5 point stop would have been ok: risk reward:7:1
Attachments
madasafish
Well-known member
- Messages
- 470
- Likes
- 5
DAX divergences today: 5 minute chart...Note the one at 17:03 at 5952 successfully said the rally would fail .. but Dax regained all lost ground at close..
Divergence earlier in day at 3567 was not as good..DAX fell another 20 points before rallying...(glad I did not take it🙂
Divergence earlier in day at 3567 was not as good..DAX fell another 20 points before rallying...(glad I did not take it🙂
Attachments
madasafish
Well-known member
- Messages
- 470
- Likes
- 5
madasafish
Well-known member
- Messages
- 470
- Likes
- 5
madasafish
Well-known member
- Messages
- 470
- Likes
- 5
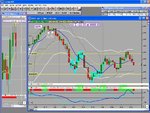
Cyanide
"What does the cyan around some of the bars signify?"
It means the market is oversold and due to rally:
the exact formula is
SSTAT <=10 and ( SLOWD#1<=20)
where SSTAT is based on: CCI<-100 in last 10 bars where CCI is 6,3 exponential (the light blue line under the chart..
and SLOWD = 9,5,5 exponential.
Works very well..
A warning only as we all know oversold markets can just keep falling... I don't trade 3 min charts on DAX.. but 1 minutes but use 3 as a guide for reversals..