Enjoy...
Right - A few things first and foremost.
1. This is covering the morning session - I did take all these trades but it is in hindsight.
2. This will get more confusing as I type but hopefully you can decipher out the useful information.
3. This uses no indicators - just lines (including fib's 50% + 61%).
4. Round numbers can make bounces very easily, you have to watch these and bank % - It's your call how you play them.
5. You must listen to this everytime you wake up to make this work:
YouTube - Survivor-Eye Of The Tiger
Let's get started.
For this to work properly you MUST have all three charts open at the same time.
This morning session was genius and it was very easy to read for take profits. I usually use a 5minute chart although to get the right time scale of this morning session 6-9 I will be showing you in 2m to cut out all the noise etc.
-------------------------------------------------------------------------------------------------
Most of the action today was between EURGBP hitting major S/R, EURO breaking out of overnight ranges and finally CABLE holding then breaking overnight ranges.
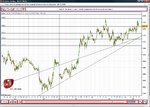
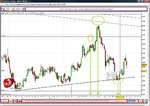
First go on 1h or 5m (then zoom out) and draw all the major trendlines:
GO TO PICTURE 1 & 2 FOR MAJOR S/R
GO TO PICTURE 3 & 4 TO UNDERSTAND THE RUNNING COMMENTARY!
A fundamental rule for when EUR/GBP hits support/resistance.
If EURGBP hits support
EURO goes up & CABLE does nothing. EURO goes down but cable goes down faster. EURO does nothing cable goes down.
If EURGBP hits resistance
CABLE goes up & EURO does nothing. CABLE goes down but EURO goes down faster. CABLE does nothing EURO goes down.
-------------------------------------------------------------------------------------------------
EURGBP has a major downtrend in place and a major level at 9328. The 9328 should hold but when broken we aim to fill the gap between 9328 and the major downtrend. In this case it is 9340~. If this trendline holds, look out for price action to go short.
The times these actually hit are:
7:58 - 9328
8:13 - 9328 broke
8:15 - 9344 target hit and profit taken.
8:16 - Trade reversed and first target = 9328 take 25% then trail stop loss until 9300 is hit, (if it breaks violently trail a very tight stoploss [2-3pips]).
8:58 - EURGBP finds minor support - Check other pairs.
EURO broken the hourly down trend, it looks supported but today is FED RATE day for the most part it will be sideways. It broke to the downside but with a tight stoploss you can make profits off fakeouts. However, after it broke the upper overnight range, the real action begins (please note most of my trades were here so it will be quite lengthy):
7:58 - Lower chart shows uptrend, it starts to build momentum and breakout of overnight range - EURGBP hits Resistance making cable shoot up, hence euro followed suit.
8:00: Temporary pullback before main move begins.
8:13 - EURGBP is heading towards 9328 - Time to trailstoplosses to take as much profit as possible.
8:15 - EURO has broken down while EURGBP has hit target.
8:16 - Look for longs, going long off the overnight range will be the ideal entry, this paired with EURGBP new found weakness will send euro flying.
8:27 - EURO has hit a round number, trail stoploss with 2-3points room.
8:28 - EURO has been squeezed down, go short after 13300 breaks with a stoploss at 13305.5(highest point*) and trail very very tightly.
8:29 - Profits taken at 13283.
8:36 - EURO hits 13305 again, got short EXACTLY on this number with a stoploss of 13305.5 - move to breakeven once euro hits 13300 then trail a tight stop afterwards.
8:38 - Profits taken at 13290.
8:58 - EURGBP MINOR SUPPORT. Result - EURO slows down to check support.
9:02 - Support is valid. Look for shorts on cable.
CABLE is midway in its overnight range. Most of the action is on the euro so it will follow suit. When euro breaks upwards it hits the top of the overnight range and pauses. This means all the action is on EURGBP and EURO at that point in time. If it were to break upwards (which it did) it will send EURGBP down and euro will follow suit up.
7:58 - EURGBP hits resistance at 9328. Cable goes up faster than euro.
8:15 - EURGBP hits resistance - This sends cable flying downwards since it's following the same sentiment of EURO.
8:34 - CABLE breaks overnight trend upwards. Missed it so will go long off a pullback / overnight range.
8:44 - Gone long watching Euro and EURGBP - Trail tight stoplosses when it hits 14300.
8:50 - 143 violently broken, taken profits once trailing stoploss of 2-3 hits.
8:58 - EURGBP finds support - Either cable must go down and euro slowly follows slowly or Euro goes up and cable does nothing.
9:00 Breaks to the downside - Short cable. Small stoplosses as usual and follow.
-------------------------------------------------------------------------------------------------
This is VERY hard for me to explain without you SEEING the live action, I might download fraps just to show how accurate it is. If the euro did breakup more my target would be 13330, however then EURGBP would have to break up. This is how I judged it was time to take profit for all EURO long plays.
You must actually view this process in action to make use of it. Most likely you will find this post uninformative and a load of ramble. Also, I will update this post as I see fit
🙂.
This is why I want to make a discussion on the topic.
(highest point*) - I call this the point of no return. Whenever you see a long tail on 5m thats where my stoploss is and i don't expect it to be hit until i've made some points!
PS. another perfect support on EURGBP send cable down right now...


