You are using an out of date browser. It may not display this or other websites correctly.
You should upgrade or use an alternative browser.
You should upgrade or use an alternative browser.
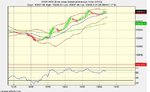
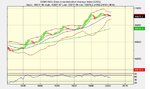
This trade is a bit risky as I missed the first two strong buy signals. This is the third one since the trend change and it's near potential resistance of 10950 but it came up there once and I trust that it will break thru this time. Will watch 10980 closely if the trade goes my way.
Attachments
JillyB
Established member
- Messages
- 791
- Likes
- 38
hungvir said:Closed the trade at break even. I don't like it when the market hesitates.
Hi Hung
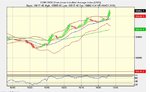
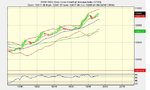
If you look on a 3hr chart you will find resistance around the 10,965-70 level. This is what it is struggling with at the moment. It's also moved a considerable distance away from the 20 MA and the price will always be drawn back to it - either by the 20MA coming up, whilst the price moves horizontally, or by the price retracing to the 20MA.
I would envisage a small retracement from the current level (10,972) before the close tonight. But overall, it's been another good day for the bulls. 😀
chindl
Well-known member
- Messages
- 348
- Likes
- 5
Big flag pole on the 30 min charts, but too late in the session. Not sure I'm focused enough for the last hr. Let's see. Missed a stonkin move from my post at 7-15, the one from the final whistle. That would have paid for the week. See Ben's been sticking his oar in again today....
JillyB said:Hi Hung
If you look on a 3hr chart you will find resistance around the 10,965-70 level. This is what it is struggling with at the moment. It's also moved a considerable distance away from the 20 MA and the price will always be drawn back to it - either by the 20MA coming up, whilst the price moves horizontally, or by the price retracing to the 20MA.
I would envisage a small retracement from the current level (10,972) before the close tonight. But overall, it's been another good day for the bulls. 😀
Thank you, Jilly. Hope you're doing well!
I haven't used three hour charts for the simple reason that ADVFN does not offer it 🙂
Later,
Hung
JillyB
Established member
- Messages
- 791
- Likes
- 38
hungvir said:Thank you, Jilly. Hope you're doing well!
I haven't used three hour charts for the simple reason that ADVFN does not offer it 🙂
Later,
Hung
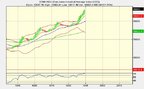
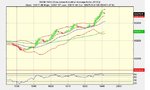
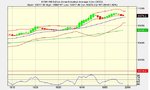
Does it have 1hr charts?
If so the resistance is evident on these too, from the 8th & 9th of June highs.
Hope this helps.
Similar threads
- Replies
- 7
- Views
- 8K
- Replies
- 20
- Views
- 13K