Diary of a swing spread better

I notice that ADVFN is much faster at this time in the morning.

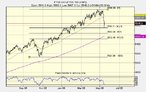
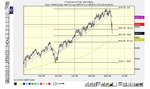
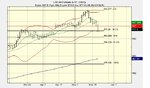
And I also noticed that the FTSE retracement stayed right on the 38 per cent mark. Who says Fib does not work? I know the market could not care less about what I think but that does not change my pessimistic view about it. I am still going to short the next rally with the target being the 50 per cent line.
 

Attachments

  • ftse fib.jpg
    ftse fib.jpg
    137.7 KB · Views: 156
And here's what happened the last time. We'll see if history repeats itself.
 

Attachments

  • last time.jpg
    last time.jpg
    145.7 KB · Views: 124
wasp said:
Noticed a possible head and shoulders on HBOS randomy earlier today. Not a stock trader but it caught my eye.

Many thanks, Wasp! I think many traders have made loads from this.
 

Attachments

  • hbos.jpg
    hbos.jpg
    131.6 KB · Views: 175
I've been trying different indicators with the market recently and haven't drawn a trend line for a while. it still works, especially when the line had been holding for half a year like this one.
 

Attachments

  • simple.jpg
    simple.jpg
    93.5 KB · Views: 147
hungvir said:
Many thanks, Wasp! I think many traders have made loads from this.


Hello Hung,

Can you elaborate on your Fib Retracement lines. Do you calculate them and draw them manually? I know very little about fibonacci but could you quickly explain how you calculate these retracement levels?

I assuming that the intermeditate levels (eg. 61% level) are standard retracements & that you take the highest high as one of the extreme lines and the lowest low as the other but over what time frame do you use and does this period vary?

Sorry for the questions but I read somewhere that Fib retracement levels can be quite useful and consequently I would like to know more.

Thanks and Happy Trading,

Chorlton
 
So that's it then. The Gunners only got Bravery Trophy. I was amazed they could hold out for that long. If only we can bend the rule and have 75 minute matches instead of 90 min ones.

Marvin,

I tried hard but could not see you on TV. I wonder if you guys will drink more or less.

We'll have to wait till next year then!

H
 
Chorlton said:
Hello Hung,

Can you elaborate on your Fib Retracement lines. Do you calculate them and draw them manually? I know very little about fibonacci but could you quickly explain how you calculate these retracement levels?

I assuming that the intermeditate levels (eg. 61% level) are standard retracements & that you take the highest high as one of the extreme lines and the lowest low as the other but over what time frame do you use and does this period vary?

Sorry for the questions but I read somewhere that Fib retracement levels can be quite useful and consequently I would like to know more.

Thanks and Happy Trading,

Chorlton

Hi Chorlton,

I just use the free charting tools at ADVFN. If you look at the pix attached, you'll see a big F (yes it starts with an F :) alongside a grid of dotted horizontal line (just one icon under T). You'll then locate the most recent significant low (the low of the most recent correction) and the most recent 'failed' high. Click on F..... then click on the high and drag it until the 100% line is just along the low.

The price is coming down to the 50% line. I should have forgotten the three up day rule and gone with my instinct this morning. Sometimes rules are there to be broken. I doubt that there'll ever be a three up day until the trend reverts back to up again.

Hope this helps!

Later,

Hung
 

Attachments

  • fib.jpg
    fib.jpg
    158.5 KB · Views: 155
None of the shares in my watch list could manage to have an up day today. I made the right decision to get out of all my longs but hesitated and did not go short. But what goes round will come round. Half a year from now, I'll be fully confident when there's a 'dip' like this.

When this depression is over, XTA, EMG, BLT and MKS are my favourites for going long.
 

Attachments

  • down day.jpg
    down day.jpg
    527.4 KB · Views: 130
Bad day for the gunners great day for my trading, just closed out my dow short for a 400 pt profit, :D Now long at 11175 sl 11075.

happy trading all
 
Wow, big congrats! It's time to buy the Gunners' fans some beer to cheer them up then :)

I am not sure if we've seen the end of this correction yet. But it may go up before coming down again.

Cheers,

Hung
 
I was expecting to see more success stories this morning, apart from Barça.

My short with UU was very profitable but I did not close it, so do not know what will happen this morning. I used a close stop and I have been wondering whether it is worth doing so. I was very close to having it triggered and it can be seen that that would have been a pity.

There are some aspects of trading that have no solution.

Split
 
Part of the dilema is our need to be constantly active in the market, for those of us that trade just one stock/index this is even harder as you have to decide when its time to reverse the position.

However i didn't just flip a coin there is method in my madness,

Bottom bolinger band has been breached

We are still in a primary uptrend

Look at a 6 month chart and you will see the dows retracements have stopped at higher levels since oct 2005

If I was to put a stop on say 60 pts above the close, if it gets hit i've lost 120pts the 60 on that short + the 60 on the long i didnt place so risk is about the same

last but most important for me

I had to go with my gut instinct.

happy trading

ps

dow has moved up in out of hours trading, off to work i go will c the damage/reward this evening. :cool:
 
Elefteros said:
dow has moved up in out of hours trading, off to work i go will c the damage/reward this evening. :cool:

That's what I have to do. I get home when my market is closed and then have to work out a plan for opening the next day. Yesterday was perfect for me- I got the top but, today, there is a lot of movement and I feel that any stops I place will be triggered

Split
 
hungvir said:
Hi Chorlton,

I just use the free charting tools at ADVFN. If you look at the pix attached, you'll see a big F (yes it starts with an F :) alongside a grid of dotted horizontal line (just one icon under T). You'll then locate the most recent significant low (the low of the most recent correction) and the most recent 'failed' high. Click on F..... then click on the high and drag it until the 100% line is just along the low.

The price is coming down to the 50% line. I should have forgotten the three up day rule and gone with my instinct this morning. Sometimes rules are there to be broken. I doubt that there'll ever be a three up day until the trend reverts back to up again.

Hope this helps!

Later,

Hung


Hung,

Thanks for the info.... :)
 
Not totally convinced that this correction is over, but if XTA can go above the 38 per cent line again, I'll long it. A stop buy order along with a stop loss one are in with Fins.
 

Attachments

  • xstrata chart.jpg
    xstrata chart.jpg
    113.8 KB · Views: 133
  • xstrata.jpg
    xstrata.jpg
    148.6 KB · Views: 148
And same with MKS
 

Attachments

  • mks chart.jpg
    mks chart.jpg
    118.7 KB · Views: 129
  • mks order.jpg
    mks order.jpg
    151.8 KB · Views: 137
hungvir said:
And same with MKS


Hi Hung,

I've started taking a look at Fibonacci Retracement levels following your recent post.

Take a look at EMG. Using the recent High and the Low for the start of the Year, the current SP is nicely positioned at the 61.8% retracement level.

Not sure at this time how relevant this is but as you seem quite keen on them, I thought I'd post my observation.

All the best,

Chorlton
 
Top