You are using an out of date browser. It may not display this or other websites correctly.
You should upgrade or use an alternative browser.
You should upgrade or use an alternative browser.
htp80 said:I work with the same timescales. I have a 4H aswell for swing trades. Missed the bounce from 5821. Won't be interested again until price hits 5871 / 73 when I'll be keeping an eye out for a short depending on how the Dow is performing. Good thread Guys.
Didn't quite get to my 71 level. Turned at 63 which is just over the 50% retracement from yesterdays high / low. So still on sidelines. Interesting to see how it reacts at 5820 support. Dow heading south so could see a break. Either way out untill Monday.
datav
Active member
- Messages
- 230
- Likes
- 9
finkyface said:Well done.
I don't have your nerve. I was in later and out earlier.
Still 10 points is fine for me. 😀
ff
Everyone has their own trading plan. It doesnt matter howmany points you go for. What counts is consistency. 10 points a day will make you rich if you can maintain it.
So trade closed out at 5854 thats 35 points this afternoon plus21 this morning making total of 56. Not bad for a Friday. What a great week we've had, Not one choppy day! Have a great weekend.
Leading indicators
Hi Datav
Always interesting posts and comments. Can you specify the leading indicators at 3 pm (UK time) and possibly why you make that selection ?
Thank you for your excellent and constant trade chronicle.
Good luck
datav said:Watch out for data at 1:30 for jobless claims and then leading indicators at 3pm (UK time) these could move the market higher, so I'll be on the lookout for another Long opportunity this afternoon.
Hi Datav
Always interesting posts and comments. Can you specify the leading indicators at 3 pm (UK time) and possibly why you make that selection ?
Thank you for your excellent and constant trade chronicle.
Good luck
finkyface said:Well it looks 'spot on' to me.
I do not how to insert a chart from ShareScope into here.
Well done Datav.
ff.
I have EOD, only. Do want any help?
Split
datav
Active member
- Messages
- 230
- Likes
- 9
fabius said:Hi Datav
Always interesting posts and comments. Can you specify the leading indicators at 3 pm (UK time) and possibly why you make that selection ?
Thank you for your excellent and constant trade chronicle.
Good luck
These are economic data releases that you must be aware of. "leading indicators" is a mix of US data on a particular day that goes by that name. You can find a calendar on yahoo finance http://biz.yahoo.com/c/ec/200638.html amoung others
datav
Active member
- Messages
- 230
- Likes
- 9
Monday 25th
Good Morning. Hope everyone had a good weekend. Great to see that we've given those yankees a good pasting in the Ryder cup!
Not much to add to UKhero's excellent post on the other thread. Charts look very bearish with a distinct possibility of new lows. and early bounce from Fridayseems likely,as US futures have recovered over the weekend and are heading towards the highs again. Must remember that the Dow and the rest are in a strong unbroken uptrend. The annual highs will most likely be tested again. While economic gloom and US slowdown fears make me think that we are likely to see some significant fall back this week. FTSE remains flat and is just itching for an excuse to drop through the floor to at least test the June lows of 5500. The downward tumble of Crude over the last 3 weeks is keeping equities at their highs. Still no sign of a turn around there.
May well see aconsolidation day, we're overdue for one, so be quick on your toes!
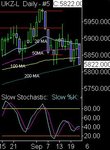
I wanted to insert a chart into a response to Zinger to confirm the 200 day SMA.
I can copy the chart from ShareScope and paste it to a Word document, but, I cannot see how to paste it into this response.
If you can help, that would be appreciated, if not, I will take a look at the FAQs later to see if there is something there.
Cheers, ff.
I can copy the chart from ShareScope and paste it to a Word document, but, I cannot see how to paste it into this response.
If you can help, that would be appreciated, if not, I will take a look at the FAQs later to see if there is something there.
Cheers, ff.
finkyface said:I wanted to insert a chart into a response to Zinger to confirm the 200 day SMA.
I can copy the chart from ShareScope and paste it to a Word document, but, I cannot see how to paste it into this response.
If you can help, that would be appreciated, if not, I will take a look at the FAQs later to see if there is something there.
Cheers, ff.
Thanks finkyface !
If you can post a chart that would be appreciated........I have looked at my charts and the 200MA was miles away !
datav
Active member
- Messages
- 230
- Likes
- 9
finkyface said:I wanted to insert a chart into a response to Zinger to confirm the 200 day SMA.
I can copy the chart from ShareScope and paste it to a Word document, but, I cannot see how to paste it into this response.
If you can help, that would be appreciated, if not, I will take a look at the FAQs later to see if there is something there.
Cheers, ff.
You need to save the chart as a jpeg file. Then when posting your message, use the manage attachments command underneath the message editing box, find the file and upload it. Like this