Hi FireWalker99,
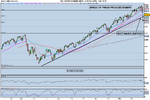
Well… The market tells you these levels by using the professional tools. I use the Integrated Pitchfork Analysis (remember… Those lines… LOL!).
I posted a few posts back the corresponding URL, for this technique… Hope you found it… If not let me know.
This professional, not well known technique uses Dr Andrews Pitchfork integrated with: Inter-market Analysis, Old high/low, strong old gap levels, Confluences, Clusters, Floor pivots (daily, weekly & monthly) and others.
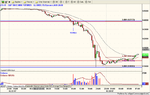
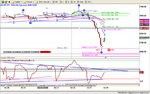
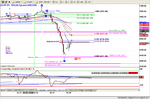
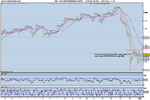
As an example, yesterday’s Drop was halted, a few points away from the cluster of an old low at 6631 & the monthly S1 pivot (see again updated joint charts).
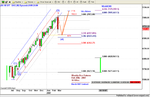
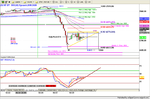
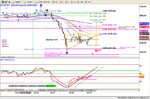
I am attaching a 3 scenario chart. The best choice & its development will depend on the Dow reaction after US News & Opening.
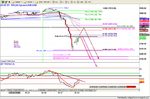
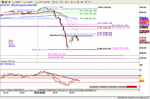
Keep in mind: once the daily pivot at 6770 is broken, with a close above, which is less probable, the next up-halt will be the cluster in 6860-65 zone, which is a very strong resistance. As long as the market stays below the daily pivot (about a 33% retrace), it signals a guarantee of a big after-noon drop, once again depending on the behaviour of the US opening markets.
Today’s US multiple news at 14:30, 15:45 & 16:00 CET will be a very strong down-sloping Catalyst or will calm down the game … for a while!
Hope this helps,
MD-doc