trendie
Legendary member
- Messages
- 6,875
- Likes
- 1,433
I don't want to hijack another thread, but there was a post about daily ranges....
(Mike Farrells EJ Daytraders v Rest of World)
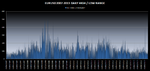
He mentioned the EJ had a recent range of a mere 60-ish, but had a one-day move of 260+ pips.
That got me thinking about daily averages.
If your strategy relies on a daily range, you have to treat big range days as windfalls.
For example, if the average is 100 pips. and your strategy relies on taking 70 pips of a given average, you CANNOT treat a random (possibly news-related) 300 pips day to skew your strat>?
Or can you?
If 4 of 5 days there is a 100 pip average, and there is a random 300 pip day, if you decide to factor in the windfall day and "hope" to stretch your average returns you run the risk of losing out on good, stable, returns for the sake of random outliers.
If you average daily range is 100, and every 5 days you get a 300 pipper......
You can either make a decent 70 pips a day, or skew your averages ( 4 x 100 plus 300 = 700).
700 / 5 days = 140 pips. 70% of 140 = 98 pips.
Not counting the outlier, the average would be 70 pips; with the outlier = 98 pips.
For the sake of stretching for an extra 20 plus pips, you could watch a decent trade fall back from a 70 pips win, to a null trade, or drag out over 2 days.
I think we need to apply some non-mathematical reasoning and recognise between "true" daily averages and windfall, outlier moves.
For example, If the market moves 100 pips a day for 4 days, then there is some outlier event for 300 pips, the "true" range is still 100 pips, but the market has corrected, or there has been some sentiment shift, and having made its correction, has settled back to its "normal" daily range.
Do any of you guys recognise the concept of an "outlier event", or would you just use simple averages to think that the daily range has changed?
(Mike Farrells EJ Daytraders v Rest of World)
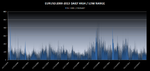
He mentioned the EJ had a recent range of a mere 60-ish, but had a one-day move of 260+ pips.
That got me thinking about daily averages.
If your strategy relies on a daily range, you have to treat big range days as windfalls.
For example, if the average is 100 pips. and your strategy relies on taking 70 pips of a given average, you CANNOT treat a random (possibly news-related) 300 pips day to skew your strat>?
Or can you?
If 4 of 5 days there is a 100 pip average, and there is a random 300 pip day, if you decide to factor in the windfall day and "hope" to stretch your average returns you run the risk of losing out on good, stable, returns for the sake of random outliers.
If you average daily range is 100, and every 5 days you get a 300 pipper......
You can either make a decent 70 pips a day, or skew your averages ( 4 x 100 plus 300 = 700).
700 / 5 days = 140 pips. 70% of 140 = 98 pips.
Not counting the outlier, the average would be 70 pips; with the outlier = 98 pips.
For the sake of stretching for an extra 20 plus pips, you could watch a decent trade fall back from a 70 pips win, to a null trade, or drag out over 2 days.
I think we need to apply some non-mathematical reasoning and recognise between "true" daily averages and windfall, outlier moves.
For example, If the market moves 100 pips a day for 4 days, then there is some outlier event for 300 pips, the "true" range is still 100 pips, but the market has corrected, or there has been some sentiment shift, and having made its correction, has settled back to its "normal" daily range.
Do any of you guys recognise the concept of an "outlier event", or would you just use simple averages to think that the daily range has changed?