Daily Quantitative Trading Ideas And Analysis

...and I fail to see what is unique about Andersen Bands. Keltner Channels could easily be 'dialed in' to look almost exactly like them.
 
Last edited by a moderator:
...and I fail to see what is unique about Andersen Bands. Keltner Channels could easily be 'dialed in' to look almost exactly like them.

Thank you for your interest. Please share how you are able to "dial in" Keltner Channels to almost look like them. I'm very interested because Andersen Bands are based on regression and standard error while Raschke's modern version of the now widely default version of Keltner Channels is based on a moving average with ATRs.

Or perhaps what you are seeing on the chart is exactly what I am pointing out - when regression, moving averages, standard deviation, ATR, and standard error all converge into a volatility squeeze, this identifies excellent points where volatility mean reversion is likely to begin occurring, in which case Andersen Bands will also track the price movement far better than a moving average.

I published this original idea for the bands in the Sept 1996 of Technical Analysis of Stocks & commodities as "Standard Error Bands". Check it out there or google for the website to learn more. Over the past couple of decades working with some of the largest institutions there have been a few refinements and discoveries to say the least. Hence, the refined version is Andersen Bands.

Cheers!
 
Can't get enough data on $ALL to illustrate my point but if you post a chart of the DOW, for example, with your Andersen Bands on it, I'll 'dial in' some Keltner channels that will look almost exactly the same and prove that you are a snake oil salesman.
 
Can't get enough data on $ALL to illustrate my point but if you post a chart of the DOW, for example, with your Andersen Bands on it, I'll 'dial in' some Keltner channels that will look almost exactly the same and prove that you are a snake oil salesman.

Keltner Channels, specifically Raschke's version has it's place. So does Boillinger. The purpose of this thread is not to debate the viability of one indicator vs another but rather to share how moving averages with ATR, and std dev converged into a squeeze at the same point with regression and std error.

Cheers!
 
Last edited:
Daily Forex Quantitative Trading Ideas And Analysis - 17 April 2018

Short-term momentum reversed up for two pairs/crosses: $EURAUD, $GBPCAD, while majors EUR turned up and AUD turned down. Long-term momentum turned up for $EURJPY.

$GBPCHF and $EURCHF are at extreme momentum levels ranked #1 and #2 for both ST and LT momentum respectively.

Daily price ranges for $AUDUSD, $AUDJPY, $CADCHF, $CADJPY, and $NZDJPY are likely to increase, while $EURCAD is likely to see an increase in both daily and 3-day price ranges. Additionally, $USDCAD is likely to see a 3-day range increase.

$AUDCHF is showing an ABS squeeze "type 3" with narrow daily and 3-day pivot ranges, increasing the likelihood of a breakout.

Daily and 3-day pivots indicate an increase in volatility for $AUDJPY, and $CHFJPY. 3-day pivots are indicating an increase in volatility for $AUDCAD and $NZDUSD. Additionally, $AUDNZD and $GBPCAD are likely to experience a swing or trend developing.

Included with this post is a table of daily USD ranges for each currency pair/cross (assuming a position size of 1 lot) from the ATI Dashboard. The ranges are color ranked for each day from highest (green) to lowest (red).

Make it a great day!
 

Attachments

  • USD Range 04-17-18.jpg
    USD Range 04-17-18.jpg
    476.8 KB · Views: 205
Trading ideas and analysis are very helpful for traders by this we can get the idea about market and stocks performance and can invest in a fruitful way.

Thank you for the feedback. As one who appreciates a variety of original ideas, I'll keep it flowing here using a less common but very effective approach to the markets.
Cheers!
 
General Motors $GM about to breakout

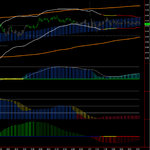
General Motors $GM is showing an Andersen Bands Squeeze ("Type 3") for an imminent breakout on a short-term basis.
 

Attachments

  • gm.jpg
    gm.jpg
    261 KB · Views: 244
Highlights from the daily Forex ATI Dashboard report going into Wednesday, 18 April-

Short-term momentum reversed up for $EURNZD and down for $GBPCAD, $NZDJPY, and one major currency - the New Zealand Dollar.

$EURCHF, $GBPCHF, and $CADCHF are at extreme short-term momentum levels and ranked 1,2,3 respectively. Similarly, the Swiss Franc is also at extreme low momentum levels.

Daily price range analysis suggests range and volatility are likely to increase for $AUDJPY, $AUDUSD, $CADJPY, $USDCAD and $USDJPY.

3-day range analysis suggests range and volatility are likely to increase for $AUDUSD, $CADJPY, and $EURJPY.

Pivot analysis indicates $EURAUD, $EURNZD, $CADJPY, and $USDCAD will see increased price action.

Additionally, $EURNZD had a bullish pivot reversal and $NZDJPY had a bearish pivot reversal.

Included with this post is a table of the short-term momentum heat map ranking for each currency pair from highest (green) to lowest (red) for each currency pair/cross and the 8 majors.

Make it a great day!
 

Attachments

  • st momo heatmap april 18.jpg
    st momo heatmap april 18.jpg
    483.1 KB · Views: 324
Daily 10 momentum stocks

Daily 10 momentum stocks - 18 April 2018
Top 5 momentum stocks of the S&P 100 are: $OXY $MON $COP $SO $AMZN

Bottom 5 momentum stocks of the S&P 100 are: $C $GS $CMCSA $WFC $BMY
 

Attachments

  • top_bottom_stocks_apr_18.jpg
    top_bottom_stocks_apr_18.jpg
    184.7 KB · Views: 197
Thanks for the feedback! Thumbnail does not look so great for some reason. Please click on it for full view. Looks a lot better!

Have a great day!

thanks, and you!

i was looking in full-view anyway, its not that, its your colours and configuration. it all looks like a bad taste jumper design from the 80s or something :D
 
Hoping to see a resumption of uptrend across equities soon - something like the second half of 2017 would be just fine.
 
Hoping to see a resumption of uptrend across equities soon - something like the second half of 2017 would be just fine.

Will be interesting to see how it plays out. From here SP 500 is at the mid-point from the all-time highs and the recent sell-off lows and meeting a critical resistance hurdle.

Cheers!
 
Highlights from the daily Forex ATI Dashboard report going into Thursday, 19 April-

Short-term momentum reversed up for $AUDNZD, $NZDJPY, and down for $GBPAUD.

While $GBPCHF has begun its decent as anticipated, short-term momentum for $EURCHF is ranked 1st and $USDCHF is 2nd. Conversely, $CHFJPY is ranked lowest at 28th and $USDCAD is 27th.

Price range is anticipated to increase for the following pairs/crosses:

$AUDJPY, $CHFJPY (also an inside day, doji, and NR7), $EURJPY, $NZDJPY, and $USDJPY.

Additionally, pivots for $USDCHF reversed to bullish and $NZDUSD bearish.

Included with this post is a table showing the 3-day price range in USD per lot for the 28 majors then color coded from highest (dark green) to lowest (dark red) for each currency pair/cross. Notice how the range leader each day was GBP, flowing diagonally over the last several days, ending with $GBPUSD.

Make it a great day!
 

Attachments

  • usd range gbp april 18.jpg
    usd range gbp april 18.jpg
    629.5 KB · Views: 205
Last edited:
Daily 10 momentum stocks - 19 April 2018

Top 5 momentum stocks of the S&P 100 are: $MON $BKNG $OXY $CVX $HAL

Bottom 5 momentum stocks of the S&P 100 are: $BAC $WFC $PEP $IBM $BMY
 

Attachments

  • top_bottom_stocks_apr_19.jpg
    top_bottom_stocks_apr_19.jpg
    191.4 KB · Views: 197
Highlights from the daily Forex ATI Dashboard report going into Friday, 20 April-

Short-term momentum changes:

Bullish - $EURGBP, $USDCAD

Bearish - $AUDUSD, $GBPJPY, $GBPUSD, $NZDJPY, $NZDUSD

Structural change has occurred for $GBPUSD (bearish) and $EURGBP (bullish).

Interestingly there were no pivot gaps on Thursday. The last time this occurred was on 8-Feb of this year.

Several of the key range expansions and price reversals from extremes that we have been anticipating and sharing have occurred. However, there are a few pairs/crosses which are likely to experience range expansions including: $EURCAD, $USDJPY, and $CADCHF

Attached to this post is an image showing Relative Range Indexes (RRI) for each currency pair to show how daily price ranges have recently increased as a percentage of their typical range. Values highlighted in blue represent 120% or greater of their typical range while those highlighted in orange were 80% or less. Bold black numbers were the highest or lowest of at least 20 days.

Make it a great day!
 

Attachments

  • RRI April 20.jpg
    RRI April 20.jpg
    410.2 KB · Views: 171
Daily 10 momentum stocks - 20 April 2018

Top 5 short-term momentum stocks of the S&P 100: $MON $OXY $COP $HAL $BKNG

Bottom 5 short-term momentum stocks of the S&P 100: $T $PEP $KHC $IBM $BMY

Top 5 long-term momentum stocks of the S&P 100: $FOXA $COP $NEE $RTN $BKNG

Bottom 5 long-term-term momentum stocks of the S&P 100: $BIIB $CMCSA $PG $GE $KHC
 

Attachments

  • top_bottom_stocks_apr_20_2.jpg
    top_bottom_stocks_apr_20_2.jpg
    201.7 KB · Views: 188
Weekly Forex Quantitative Trading Ideas And Analysis - 23 April 2018

Highlights from the weekly Forex ATI dashboard report going into Monday, 23 April-

Weekly price range compression for $EURJPY, $CADJPY, and $USDJPY reached significant levels and are likely to rebound.

Weekly price action structures have shifted for the following:

Bullish - $AUDNZD, $EURNZD, $GBPNZD

Bearish - $CHFJPY, $NZDUSD

Confirmation utilizing Andersen Bands and other tactical trading tools are suggested for these actionable trades.

The 30-day correlation matrix from the weekly Forex ATI report is included with this post for additional observation.

Have a great week!
 

Attachments

  • correlation fx 23 apr 18_1080556.png
    correlation fx 23 apr 18_1080556.png
    423.1 KB · Views: 155
Top