AndersenBands
Well-known member
- Messages
- 462
- Likes
- 0
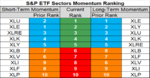
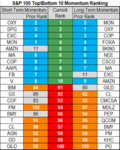
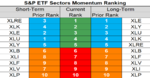
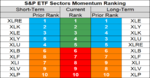
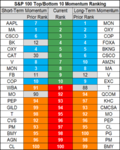
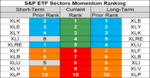
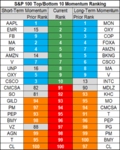
S&P 500 Sector ETF Momentum Rankings - 04 May 2018
S&P 500 Sector ETF Short-Term Momentum Rankings:
1. $XLU 2. $XLE 3. $XLRE 4. $XLK 5. $XLY 6. $XLB 7. $XLV 8. $XLI 9. $XLF 10. $XLP
Long-Term Momentum Rankings:
1. $XLE 2. $XLY 3. $XLU 4. $XLK 5. $XLRE 6. $XLB 7. $XLF 8. $XLV 9. $XLI 10. $XLP
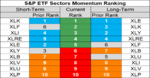
S&P 500 Sector ETF Short-Term Momentum Rankings:
1. $XLU 2. $XLE 3. $XLRE 4. $XLK 5. $XLY 6. $XLB 7. $XLV 8. $XLI 9. $XLF 10. $XLP
Long-Term Momentum Rankings:
1. $XLE 2. $XLY 3. $XLU 4. $XLK 5. $XLRE 6. $XLB 7. $XLF 8. $XLV 9. $XLI 10. $XLP