Daily News Analysis By Ultima Markets

Policy Pause and Valuation Concerns: Market Sentiment Shifts to Caution​

Expectations for a December Fed rate cut have cooled significantly, with market sentiment shifting from risk-on to risk-averse. Technology stock valuations are under pressure, and investors are focused on Nvidia’s earnings report and delayed US core data.

The market opened cautiously today, reflecting the impact of last week’s sharp stock market correction and rising expectations that the Federal Reserve (Fed) may pause its easing cycle in December. Investor sentiment has clearly shifted from a previous “risk-on” to a more defensive “risk-off” mode.
  • Fed Policy Shift : The probability of a 25 basis point rate cut in December has plummeted to only about 50% (compared to nearly 95% a month ago). Several Fed officials have made noticeably hawkish statements; for example, Cleveland Fed President Beth Hammack stated, “There is no clear need for further easing at this time.”
  • Market Impact : The declining probability of an interest rate cut poses structural headwinds for risk assets, while supporting the dollar and putting pressure on overvalued assets.

Equities & Risk Assets: Strengthening Correction Signals

Last week’s sharp decline highlighted valuation fragility and technical weakness.
  • Valuation Nervousness: The Nasdaq’s over 2% drop was primarily driven by renewed concerns about a valuation bubble in AI concept stocks.
  • Key Events: This week will see high-risk events, including delayed NFP and CPI data and Nvidia’s earnings report (Wednesday, November 19). Any disappointing earnings report or data could exacerbate valuation concerns and trigger a deeper correction.

Dollar Outlook: 99 Level Support Remains Strong

The US Dollar Index (USDX) is currently in a tug-of-war. Hawkish comments from the Federal Reserve remain the dominant force, maintaining the dollar’s structural upward trend.
  • Technical Analysis: The dollar remains stable above the 99.00 support level.
  • Market Outlook: As long as the 99.00 support level holds, there is still a chance to retest 100.00 in the short term.

USDX, H4 Chart | Ultima Markets MT5

Risk Warning: Trading leveraged derivatives involves high risk and may result in capital loss.

Disclaimer: The comments, news, research, analysis, prices, and other information contained in this article are for informational purposes only and are intended to help readers understand market conditions. They do not constitute investment advice.
 

Markets prepare for Nvidia’s earnings report; risk appetite cools ahead of the data release​

Market sentiment turned cautious as investors awaited Nvidia’s earnings report and delayed U.S. economic data (NFP, CPI, PCE). Hawkish signals from the Federal Reserve weakened expectations of rate cuts, supporting the dollar while putting pressure on technology stocks, gold, and high-beta assets.

Market sentiment has clearly shifted to a “risk-off” mode today . The market is currently positioning itself for high-risk investments, with attention focused on tomorrow’s NVIDIA earnings report and the uncertainty surrounding the Federal Reserve’s policy path.

Technology Sector and US Data Outlook

  • NVIDIA’s Test : The future direction of the AI-driven market rebound will be determined by NVIDIA’s third-quarter earnings report tomorrow (Wednesday). If the earnings report or guidance falls short of expectations, it could trigger a deeper correction.
  • Data Frenzy : Following the US government’s reopening, long-delayed economic data ( NFP , CPI , PCE ) is about to be released. The Non-Farm Payrolls (NFP) report is confirmed to be released this Thursday (November 20). These data will determine whether the Federal Reserve’s “hawkish pause” stance is justified.

Federal Reserve Policy and Gold/Foreign Exchange Outlook

  • Rate cut expectations have declined significantly : Expectations for rate cuts have been further delayed. Hawkish signals from the Federal Reserve have weakened expectations of rate cuts, while also putting pressure on highly valued assets.
  • US Dollar Outlook : The US dollar remains stable above the 99.00 support level, and the structural upward trend remains unchanged.
  • Gold Outlook : Despite the market’s shift towards risk aversion, gold is struggling to maintain its safe-haven asset role, with capital continuing to favor the US dollar. As long as support around $4,000 holds, gold is likely to remain range-bound in the short term.

XAU/USD, H2 Chart | Ultima Markets MT5

Stock Market: Correction Confirms Weakness

The Nasdaq 100 (NAS100) broke below the key 25,000 support level, confirming a technical breakout from its previous upward channel. This suggests the index may be entering a longer correction phase.

Nasdaq 100, Daily Chart | Ultima Markets MT5

Risk Warning : Trading leveraged derivatives involves high risk and may result in capital loss.

Disclaimer : The comments, news, research, analysis, prices and other information contained in this article are for informational purposes only and do not constitute investment advice.
 

Ahead of Nvidia’s earnings report, global stock markets are facing a “final exam” for tech stocks​

On November 19, 2025, global stock markets continued their correction. The three major US stock indices, the European STOXX 600, the German DAX, the UK FTSE 100, and major Asian markets all closed lower, with technology stocks being the most significant drag on this correction. Market sentiment was highly tense, solely due to the upcoming release of NVIDIA’s Q3 2025 fiscal year earnings report after the US market closes tonight, which was seen as a crucial “final exam” determining the fate of the AI bull market.

Why have tech stocks suddenly become the target of public criticism?

Over the past year, the tech frenzy driven by generative AI has been almost entirely fueled by Nvidia’s outstanding performance. From the explosive popularity of ChatGPT to the advent of the Blackwell architecture, the market has given Nvidia a valuation premium far exceeding that of traditional tech companies. However, as the index repeatedly hits new highs, investors are beginning to worry: is this surge supported by fundamentals, or is it purely speculative hype?

The Nasdaq 100 index has plunged nearly 8% in the past two weeks, breaking below the 25,000-point mark, the 50-day moving average, and the long-term upward channel, showing clear signs of technical weakness. This correction reflects not only profit-taking but also a deep-seated doubt in the market about whether high valuations can continue to be realized.

The answer lies in tonight’s earnings report and forward guidance.​

Three key points to watch in Nvidia’s financial report
  1. revenue and profit
    are approximately $54.9 billion, with data center revenue exceeding $48 billion, primarily driven by the ramp-up of Blackwell chips.
  2. the gross profit margin
    can maintain an exceptionally high level of over 75% will directly affect market confidence in pricing power.
  3. The most crucial forward guidance,
    covering Q4 of fiscal year 2025 and the full year of 2026, is the real answer to whether the stock price will hit its ceiling or bottom.
    • If guidance is significantly raised → high valuations will be backed by fundamentals, and tech stocks are expected to rebound strongly.
    • If only the criteria are met or slightly revised upwards → high-level fluctuations, valuation pressure continues to intensify.
    • If the forecast is lowered or conservatively adjusted, concerns about a bubble burst will be confirmed, and the Nasdaq may face a mid-term correction.

Understanding the Technical Levels of the Two Major US Stock Indices

Nasdaq 100 (NAS100): The most vulnerable leading indicator

  • It has fallen below 25,000 points, the 50-day moving average, and the lower edge of the upward channel.
  • Currently in a technical downtrend dominated by bears.
  • The next key support level is 24,000 points (corresponding to the 100-day moving average and the previous high area).
    If this level is breached, it will confirm a broader structural pullback, with the decline potentially extending to 15%-20%.

NAS100, Daily Chart | Ultima Market MT5

S&P 500 (SP500): Relatively resilient, but the outlook is not optimistic.

  • Short-term key support: around 6,500 points
  • Currently, the market is consolidating below the previous high resistance zone.
    As long as the 6,500-point level is held, the bullish structure remains intact. However, if Nvidia’s earnings report is disappointing or subsequent data is overheated, causing a drop below the 6,500-point level, it indicates that the correction has spread from technology stocks to the overall market, and the magnitude and duration of the adjustment will be significantly prolonged.

S&P 500, Daily Chart | Ultima Market MT5

US economic data releases resume; September non-farm payroll report to be released this Thursday

Economic data that had been piling up during the US government shutdown will be released starting this week, with the most anticipated September non-farm payroll report (originally scheduled for October 3) now confirmed for release on November 20 (Thursday). This data will be the first report to fully reflect the true state of the US economy since the shutdown, and will directly test the Federal Reserve’s recent hawkish stance of “pausing interest rate cuts.”

If employment and wage data are overheated, the probability of an interest rate cut in December will be further reduced, which would be a double blow to the already fragile stock market.

Gold prices remain stable above the $4,000 mark as safe-haven demand counters the strength of the US dollar

Despite the turmoil in the stock market and the strengthening of the US dollar, gold (XAU/USD) has shown remarkable resilience, continuing to hold firmly above the psychological level of $4,000. Technically, it exhibits a wide range of fluctuations at high levels, with strong short-term support and upward pressure from rising US Treasury yields.

For gold bulls, the real catalyst for a breakout may be a sell-off in risk assets triggered by Nvidia’s earnings report tonight.


XAU/USD, H2 Chart | Ultima Market MT5

Conclusion: The real battle will begin in the latter half of this week.

The market movement on November 19th was merely the calm before the storm. The true direction will be revealed after the dust settles on the following two major events:
  • Nvidia’s earnings report tonight → Will determine the valuation ceiling for tech stocks
  • Non-farm payroll data to be released on Thursday → Will determine the likelihood of a Fed rate cut in December.
Until the outcome becomes clear, risk appetite will remain low, and it is advisable to remain on the sidelines or maintain a light position in high-volatility assets. Once the direction becomes clear, regardless of whether the market is bullish or bearish, rare trend-driven opportunities will emerge.

Risk Warning : Trading leveraged derivatives involves high risk and may result in capital loss.

Disclaimer : The comments, news, research, analysis, prices and other information contained in this article are for informational purposes only and do not constitute investment advice.
 

AI rebound saves the day, dollar dominates trend: non-farm payrolls become the next trigger​

Tech stocks triumph: Nvidia ends its losing streak

Nvidia’s third-quarter earnings report, released after the market closed yesterday, delivered a decisive positive surprise, immediately ending a four-day losing streak in the market.
  • Record-breaking and exceeding expectations : Revenue reached $57 billion , far exceeding the expected $55.4 billion . Data center revenue hit a record high of $51.2 billion .
  • Strong guidance : The company issued strong fourth-quarter revenue guidance of $65 billion , far exceeding the market consensus of $61.8 billion . CEO Jensen Huang denied the existence of an AI bubble, stating that “Blackwell product sales are exceptionally strong.”
  • Market reaction : US stock index futures surged, with Nasdaq futures rising more than 2% in after-hours trading . Strong outlook guidance validated the valuation premium across the entire AI ecosystem.

FOMC Disagreements and a Stronger Dollar

The minutes of the FOMC meeting released yesterday revealed a clear division within the committee.
  • Policy divergence : “Many members” supported keeping interest rates unchanged in December, while “a few members” favored further rate cuts. After the minutes were released, the market’s pricing in a 25 basis point rate cut in December fell to about 35% .
  • Impact on the US Dollar : This change reinforces the view that the Federal Reserve is more inclined to pause rather than begin a rate-cutting cycle. This hawkish stance continues to support the dollar, pushing it above 100 points to a six-month high.

USDX, Daily Chart | Ultima Markets MT5

Non-Farm Payrolls Report: Market Focus

Market focus has shifted entirely to the long-delayed September non-farm payrolls report , the first major indicator of a healthy economy since the government shutdown.
  • Market consensus : The estimated increase in jobs is around 50,000 , still reflecting a slowdown in the labor market.
  • Strong non-farm payrolls (hawkish) : If the number of new jobs is much higher than 50,000, it will confirm that the Fed will maintain a cautious stance, which may trigger further strengthening of the US dollar and may partially reverse the stock market rebound led by Nvidia.
  • Weak Non-Farm Payrolls (Dovish) : If the data falls short of expectations, it will increase pressure on the Fed to cut interest rates in December, risk assets may continue to rebound, and the US dollar may weaken.

US Dollar Outlook: GBP/USD to Maintain Bearish Trend

If the US dollar continues its strength after the NFP report is released, GBPUSD will exhibit the clearest bearish structure.
  • Technical confirmation : The currency pair has formed a double top pattern and confirmed a break below the 1.3200 support level, with momentum leaning towards further downward movement.
  • Downside target : If selling pressure continues, GBPUSD could open up space towards the 1.2850 area.

GBPUSD, Daily Chart | Ultima Markets MT5

Risk Warning : Trading leveraged derivatives involves high risk and may result in capital loss.

Disclaimer : The comments, news, research, analysis, prices and other information contained in this article are for informational purposes only and are intended to help readers understand market conditions. They do not constitute investment advice.
 

Mixed employment data and hawkish realities impact the stock market​

Global stock markets weakened, and Nvidia’s strong earnings report couldn’t offset the Federal Reserve’s hawkish stance. Mixed non-farm payroll data dampened expectations of interest rate cuts, leading to a more cautious market risk appetite.

Yesterday, the initial risk-on rally quickly crumbled, with global stock markets generally declining, led by the Nasdaq. The market was forced to confront the contradiction between Nvidia’s strong earnings report and the Federal Reserve’s increasingly hawkish policy stance .

“Mixed Signals” in the US Labor Market

  • A sign of resilience : The delayed September nonfarm payrolls report showed an increase of 119,000 jobs , far exceeding the expected 50,000 , initially indicating that the labor market remains resilient.
  • Potential weakness : The unemployment rate rose to 4.4% , and job growth in previous months was revised downward, echoing the Federal Reserve’s assessment that the job market is cooling.
  • Policy Impact: A sharp cooling of interest rate cut expectations , coupled with stronger-than-expected job growth and continued hawkish statements from Federal Reserve officials, has significantly reduced market expectations for a December rate cut, currently pricing in only a 27% probability. This reinforces the structural reality that “ high interest rates will persist for a longer period .”

Stock Markets and Cryptocurrencies: Technical Crash and Bear Market Concerns

  • Equity Vulnerability : Despite Nvidia’s strong earnings, the Nasdaq quickly reversed course, demonstrating that corporate profits alone are insufficient to withstand valuation pressures in a high-interest-rate environment . The S&P 500 fell back below its 50-day moving average, technically confirming the downward momentum of recent weeks.

S&P 500, Daily Chart | Ultima Markets MT5
  • Cryptocurrency crash : The collapse in risk appetite quickly spread to speculative assets. Bitcoin broke below the key psychological level of $90,000 and fell below the $90,000–$88,000 support zone. This technical breakdown and deteriorating fundamentals have led to discussions about whether a deeper “bear market” for risk assets is underway. Bitcoin’s momentum is weak, and it is expected to remain below $90,000 .

BTCUSD, Daily Chart | Ultima Markets MT5

Daily Summary: Focus Shifts to CPI

cautious today . Strong employment signals have reinforced market confidence that the Federal Reserve is “in no hurry to cut interest rates” in the short term. Short-term focus shifts to today’s S&P Global PMI data. The next key catalyst will be the return of US CPI data, which the market urgently needs to determine the next easing path.

Risk Warning : Trading leveraged derivatives involves high risk and may result in capital loss.

Disclaimer : The comments, news, research, analysis, prices and other information contained in this article are for informational purposes only and are intended to help readers understand market conditions. They do not constitute investment advice.
 

Policy Shift: Dovish Signals Boost Expectations of a December Rate Cut​

A surge in expectations of a December rate cut weighed on the dollar, while continued valuation concerns in the technology sector limited risk sentiment. The market is focused on the inflation data gap, PPI trends, and the impact of the technology sector on overall sentiment.

Last Friday, Federal Reserve (Fed) officials released a slightly dovish signal, with key officials such as John Williams, president of the Federal Reserve Bank of New York, suggesting that the Fed “still has room to cut interest rates” if inflation continues to decline.
  • Rate cut expectations have rebounded : The market’s probability of a 25bps rate cut in December has rebounded significantly, jumping from about 30% to about 70% currently .
  • Impact of the US Dollar : The US dollar index is under pressure and is currently hovering around the key 100.00 level. The lack of momentum to break through the 100-100.30 resistance zone is a concern for the bulls.

USDX, H4 Chart | Ultima Markets MT5

Inflation data uncertainty and PPI focus

With the government shutdown over, market focus has shifted to the delayed release of data, but inflation data faces an “information vacuum.”
  • CPI Release Cancelled : The Bureau of Labor Statistics (BLS) has officially cancelled the release of the October CPI due to incomplete data collection during the shutdown.
  • Current focus : Market attention is shifting to the September PPI (Producer Price Index) , to be released on Tuesday (November 25) . Weak PPI data would reinforce dovish expectations, further supporting a 70% probability of a December rate cut.

Unease persists in the technology sector.

Despite Nvidia’s strong earnings report last week, concerns about its overall valuation persist. The Nasdaq’s technical outlook remains fragile due to its recent sharp decline.
  • Nasdaq (NAS100) Technical Analysis : After significant volatility last week, the index is attempting to consolidate. The 24,000–25,000 range is the key focus in the short term, with the overall outlook remaining neutral to cautiously bearish .

NAS100, Daily Chart | Ultima Markets MT5

Risk Warning : Trading leveraged derivatives involves high risk and may result in capital loss.

Disclaimer : The comments, news, research, analysis, prices and other information contained in this article are for informational purposes only and are intended to help readers understand market conditions. They do not constitute investment advice.
 

With the market betting on a December rate cut, the PPI has become the focus​

Waller supports a December rate cut, solidifying the Fed’s dovish stance and raising the probability of a rate cut to 80%. Today’s PPI data is crucial and will determine whether the dollar can hold the 100 mark.

Today saw a decisive shift in market sentiment. Concerns about “higher-for-longer” interest rates are rapidly fading, replaced by renewed optimism that the Federal Reserve may cut rates in December.
  • Waller’s dovish signal : Federal Reserve Governor Christopher Waller has made it clear that he supports a rate cut at the December meeting. He warned that maintaining restrictive interest rates for too long could harm the labor market.
  • Rate cut probability surges : Waller’s comments drive market expectations for aggressive repricing. CME FedWatch shows an approximately 80% probability of a 25 basis point rate cut in December , making a rate cut the new benchmark scenario.

PPI: A decisive indicator of inflation

With the US government shutdown leading to the cancellation of the October CPI data release, the September Producer Price Index (PPI) released today is of unusual importance, becoming the only reliable proxy indicator for current inflation dynamics.
  • Soft PPI Expectations : Weak PPI readings (in line with or below the 0.3% forecast) would reinforce dovish sentiment, strengthen the case for a December rate cut, and could add further downward pressure on the dollar.
  • High PPI risk : Higher-than-expected PPI will challenge the emerging dovish narrative, restart market volatility, and may force the Federal Reserve to return to a more cautious “wait-and-see” stance.

Outlook for the US Dollar and Risk Assets

  • The dollar is under pressure : As the market digests the Fed’s more dovish stance, the dollar index has hovered around the 100.00 level for four consecutive trading days. A break below 100.00 could trigger a new round of short-term dollar weakness.

USDX, Daily Chart | Ultima Markets MT5
  • Risk appetite returns : The prospect of cheaper liquidity has revitalized risk appetite, leading to a rebound in the Nasdaq and S&P 500 indices, while also boosting the cryptocurrency market, including Bitcoin and Ethereum.
  • Bitcoin (BTC) : From a technical perspective, Bitcoin needs to reclaim the psychological level of 90,000 to confirm improved sentiment and unlock further upward momentum.

BTCUSD, Daily Chart | Ultima Market MT5

Risk Warning : Trading leveraged derivatives involves high risk and may result in capital loss.

In summary , the market has shifted from “fearing the Fed” to “betting on the Fed.” If today’s PPI meets expectations, it will kick off a pre-holiday rebound in stocks and cryptocurrencies, likely at the cost of a weaker dollar.
 

PPI data confirms dovish shift, dollar breaks below key support​

September’s moderate decline in PPI confirmed a dovish shift by the Federal Reserve, causing the dollar to break below key support and significantly increasing expectations for a December rate cut. The weaker dollar boosted gold, with the market focusing on employment and durable goods data.

Producer Price Index (PPI) data
released yesterday became the main basis for the market’s confirmation of the Federal Reserve’s (Fed) dovish shift.
  • Key PPI data : PPI month-on-month was +0.2% (lower than the expected +0.3%), and core PPI year-on-year was +2.6% (lower than the previous value), confirming that inflationary pressures at the wholesale level are easing.
  • Policy expectations : The market’s probability of a 25 basis point rate cut in December has surged to nearly 90% . The market believes that a rate cut in December is not only possible, but very likely to happen.
  • US Dollar Update : The US Dollar Index (USDX) has clearly broken below the psychological level of 100.00 , marking its first close below this key support level since last week. This break signifies a shift from a “bullish consolidation” to a short-term bearish trend for the dollar . The dollar has now entered a “sell on rallies” environment.

USDX, H2 chart | Ultima Markets MT5

Gold Outlook: Bullish Reversal Completed

Gold is a major beneficiary of a weaker dollar and established expectations of interest rate cuts. Lower interest rates reduce the opportunity cost of holding non-yielding assets such as gold, while a weaker dollar boosts global purchasing power.
  • Technical Analysis : Gold has completed a clear bullish reversal , holding firm on the $4,100 support level and continuing its upward trend.
  • Upside target : The short-term buyer’s target is the $4,150 resistance zone. If it breaks through, it may further challenge the $4,200 area.

XAU/USD, H2 Chart | Ultima Markets MT5

Today’s market focus: Unemployment benefits and durable goods orders

With the release of the PCE price index and revised Q3 GDP figures postponed to December, the market will need to focus on alternative data.
  • Weekly unemployment claims (released earlier due to the holiday): A significant increase in claims would reinforce the Fed’s dovish shift .
  • Durable goods orders (October): Strong data could support the dollar; weak data would weigh on the dollar and reinforce expectations of a December rate cut.
Risk Warning : Trading leveraged derivatives involves high risk and may result in capital loss.

Disclaimer : The comments, news, research, analysis, prices and other information contained in this article are for informational purposes only and are intended to help readers understand market conditions. They do not constitute investment advice.
 

Silver hits new high again: Will $54 trigger a breakout or a double top reversal?​

XAGUSD Daily Chart Analysis

The daily chart presents a strong bullish configuration . The market is currently at the breakout level of $53.91 .
  • Key resistance : The most immediate and critical resistance lies between $53.91 and $54.10 , marking the shadow of the high in mid-October.
  • Bullish Scenario : Traders should cautiously wait for a clear breakout above $54.00 on the daily closing price to confirm the breakout. If the $54 level is broken, the next upside target will be the psychological level between $55.00 and $56.00 , at which point the asset will enter a “price exploration” mode.
  • Potential risks : We need to be wary of the possibility of falling into a potential “ double top “ reversal state.

XAGUSD Daily Chart | Source: Ultima Markets MT5

XAGUSD 2-hour chart analysis

The moving averages confirm strong upward momentum . Prices are moving along the purple (short-term) moving average, which acts as dynamic support, reflecting strong and active buying interest. The Stochastic Oscillator has bounced off the midline (50) without falling into oversold territory, representing a bullish signal known as a “ bullish shakeout “ or reset.
  • Bullish breakout scenario : The trigger point is a H2 closing price break above $54.10 , supported by the purple moving average and confirmed by the stochastic oscillator remaining above 80. The initial target is $55.00 .
  • Bearish pullback scenario : This will be triggered if $54.00 is breached and the H2 closing price falls below the purple moving average (approximately $53.00 ). The target is the black (medium-term) moving average near $51.90 .

XAGUSD 2-hour chart | Source: Ultima Markets MT5

XAGUSD 30-minute chart insight

The chart shows a healthy and strong upward trend. Although overbought oscillators warn of caution, the alignment of moving averages suggests that any pullback to $53.40 is likely to find support , indicating that the path of least resistance remains upward .
  • Bullish continuation : The trigger point is a confirmation of a close above $53.90 on the 30-day moving average . The initial target is $54.25 , followed by $54.50 .
  • “Buy on dips” : When the price falls back to the purple moving average at $53.40 , look for a rejection line with a long lower shadow as a confirmation signal.
  • Short-term reversal : The trigger point is a strong bearish candlestick closing below the black moving average at $52.90 , which would indicate that the market is entering a deeper correction phase.

XAGUSD 30-minute chart | Source: Ultima Markets MT5

Risk Warning : Trading leveraged derivatives involves high risk and may result in potentially rapid and substantial capital losses.

Disclaimer : The comments, news, research, analysis, prices and other information contained in this article are for informational purposes only and are intended to help readers understand market conditions. They do not constitute investment advice.
 

The outlook for the US dollar and stock market hinges on the Powell and PCE test​

Dollar and Stock Market Outlook: The market is focused on Powell and the upcoming PCE data. The market has already priced in a near 90% probability of a Fed rate cut in December, putting technical pressure on the dollar.

The core theme in today’s markets lies in the tension between the Federal Reserve’s increasingly dovish stance—which supports risk assets—and the potential challenges posed by Powell’s speech and the PCE data this week.
  • Rate cut expectations : The market is currently pricing in an 87%–90% probability of a rate cut in December , driven by strong dovish signals from several Fed officials last week.
  • Hawkish risk : The Fed’s official stance remains cautious. If Powell signals a “wait-and-see” approach this week or mentions “persistent inflation risks,” the dollar may rebound immediately.
  • A key test for PCE : The Fed’s preferred inflation gauge— the September PCE price index —will be released this Friday (December 5th). If the PCE data is higher than expected , it will immediately challenge the nearly 90% probability of a December rate cut.

The US dollar faced technical pressure, while the stock market rebounded above 6,700.

  • US Dollar (USDX) : With the market fully pricing in a December rate cut, the US dollar has technically formed a double top near 100.00 , confirming a medium-term bearish trend. If the dollar breaks below the 99.00-99.25 range, the downside could reach 98.00 .

USDX, H4 Chart | Ultima Markets MT5
  • Stocks (S&P 500) : The S&P 500 has returned above 6,700 , invalidating the short-term bearish structure. However, resistance near the previous high of 6,900 may still limit further gains.

S&P 500, Daily Chart | Ultima Markets MT5

Today’s focus: ISM Manufacturing PMI

Today, investors will be watching the ISM Manufacturing PMI to get a sense of factory activity.
  • Weak data : If the ISM remains in contraction territory (below 50 ), it will support the Fed’s stance on interest rate cuts.
  • Market Summary : The market is in a “Fed-driven” phase, with risk assets rising due to dovish signals. However, the subsequent trend depends on this week’s economic data and central bank messages, with Friday’s PCE being a key driver .

Risk Warning : Trading leveraged derivatives involves high risk and may result in capital loss.

Disclaimer : The comments, news, research, analysis, prices and other information contained in this article are for informational purposes only and are intended to help readers understand market conditions. They do not constitute investment advice.
 

Policy disagreements dominate global markets; silver hits record high, USD/JPY under pressure​

Global markets opened today caught in a tug-of-war between policy uncertainty and structural changes. Despite limited volatility on Monday, the latest macroeconomic news has revealed a clear policy divergence – a slowdown in US economic growth versus rising risks of interest rate hikes in Japan, directly impacting the dollar’s performance, USD/JPY, and precious metal prices.

The US ISM Manufacturing PMI indicates increasing pressure on economic slowdown.

The newly released November ISM Manufacturing PMI weakened again, casting a shadow over the optimistic narrative of “economic resilience.”
  • The index fell to 48.2 , marking the ninth consecutive month below the 50-point contraction threshold.
  • It also hit a nearly four-month low.
The prolonged contractionary trend highlights the continued suppression of the real economy by high interest rates, which is detrimental to cyclical sectors such as energy and industry. However, this “bad news” has further strengthened market bets on a December rate cut by the Federal Reserve , supporting demand for safe-haven and defensive assets.

The Bank of Japan has signaled the risk of interest rate hikes, fueling expectations of a narrowing US-Japan interest rate differential.

In stark contrast to weak US economic data, Bank of Japan Governor Kazuo Ueda clearly signaled a hawkish stance in his latest remarks:
  • If “underlying inflation” accelerates further, the Bank of Japan is prepared to adjust its policy.
  • The adjustment may include a formal interest rate hike.
  • The Bank of Japan is also monitoring the impact of the new government’s fiscal stimulus on inflation.
This signal is quite different from the Fed’s gradual shift towards easing, and the market has begun pricing in a narrowing of the US-Japan interest rate differential in early 2026 , putting downward pressure on USD/JPY .

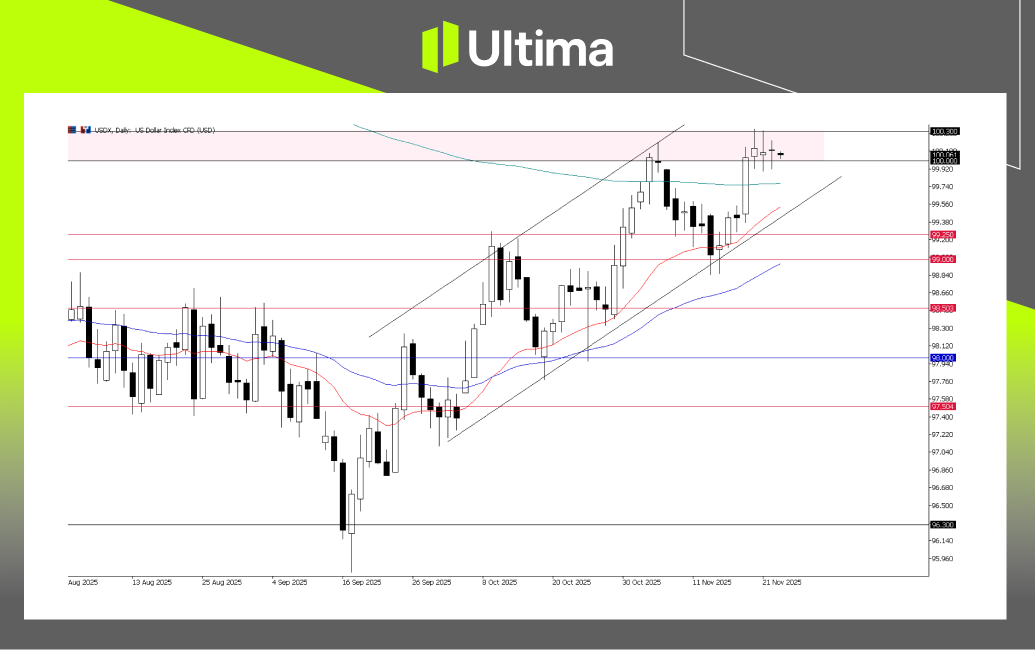
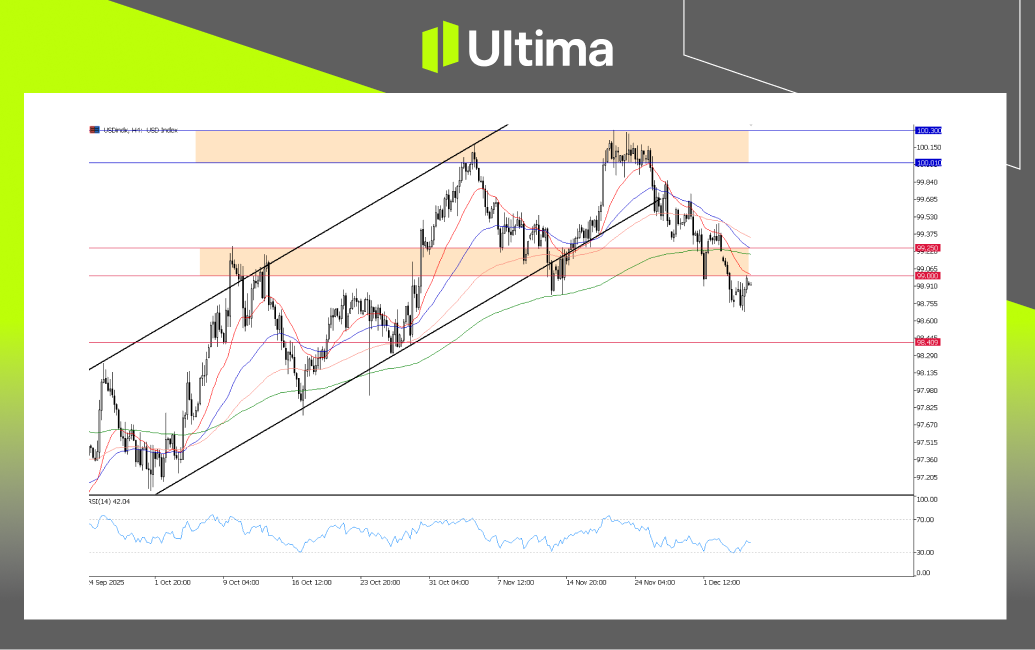
Market News: Silver breaks through $58; Trump appoints new Federal Reserve Chairman

1. Trump finalizes nominee for Federal Reserve Chair

US President Trump announced that he has chosen his successor as the next Federal Reserve Chairman, succeeding Jerome Powell. This move adds uncertainty to the policy outlook for 2026.
  • The market is focused on whether the new chairman will be more dovish or hawkish.
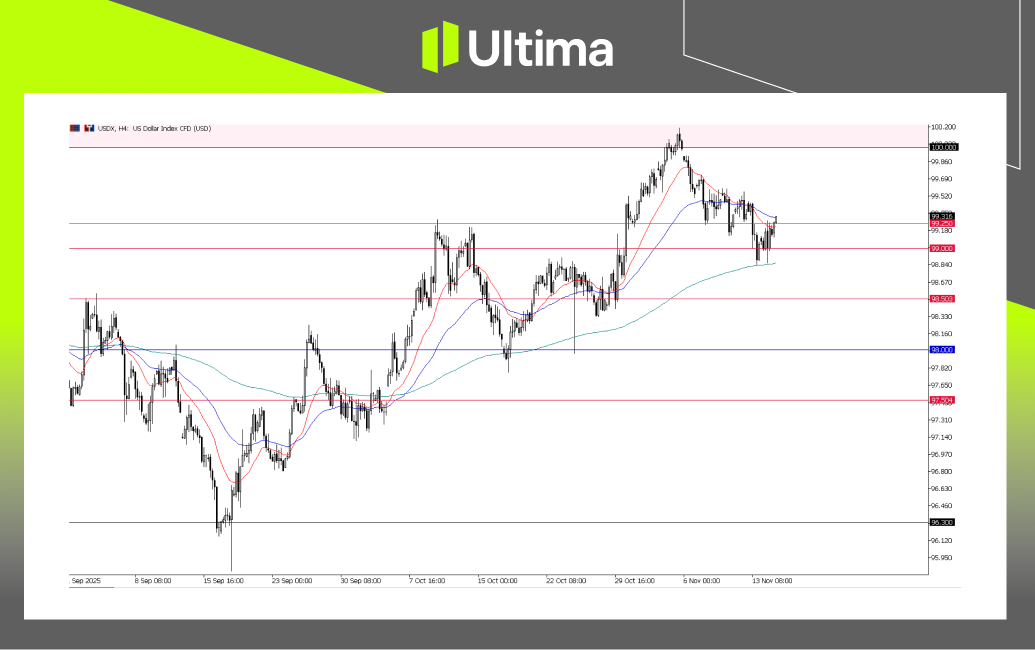
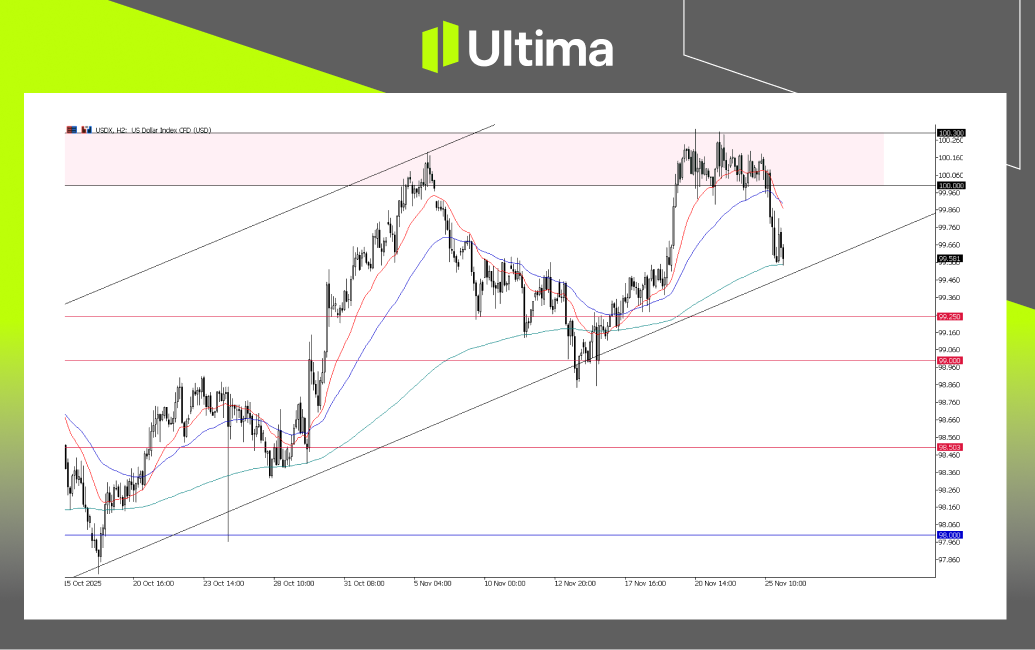
  • With the candidate’s stance still unclear, this news may limit the short-term upside potential of
    the US dollar index.

2. Silver hits a record high ($58/ounce)

Spot silver broke through $58/ounce for the first time , setting a new historical high and becoming one of the focal assets of this round of market activity.
  • Long-term structural supply shortage
  • Industrial demand continues to rise
  • Market expectations that a Federal Reserve rate cut would bring “cheaper money” fueled an influx of speculative funds.
Silver is showing strong upward momentum, supported by both a supply gap and expectations of monetary easing.

Today’s focus: USD/JPY and silver, gold

With the earlier US government shutdown causing delays in economic data, and a lack of major data releases this week, market focus has shifted:
  • the US economic slowdown and the Bank of Japan’s hawkish turn being priced in?
  • Is the USD/JPY pair turning further bearish?
  • Risks and opportunities in silver and gold trading at high levels.

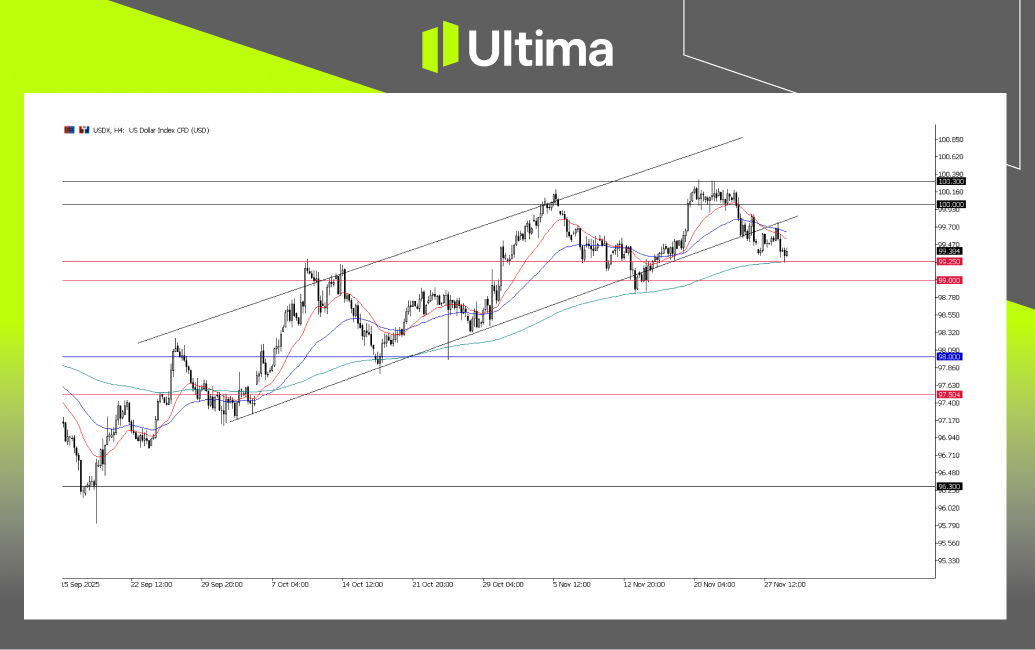
USD/JPY: Price Movement Risks Amid Narrowing Policy Spreads

With the combination of “the Federal Reserve may cut interest rates, while the Bank of Japan may raise interest rates,” USD/JPY is facing pressure from both sides:
  • Federal Reserve: Weak ISM manufacturing data supports expectations of a December rate cut.
  • Bank of Japan: Ueda’s hawkish comments make the yen attractive as the dollar weakens.

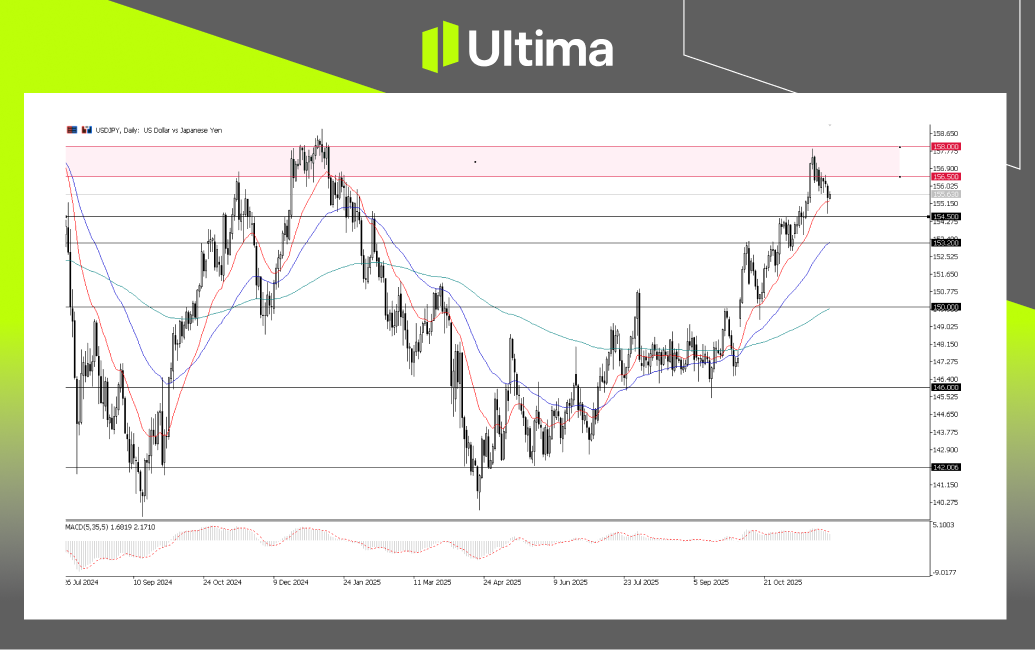
USD/JPY, Daily Chart | Ultima Market MT5

From a technical perspective:
  • The overall structure remains bullish, but downside risks are rising in the short term.
  • 156.50–158.00 range represents the previous high in January 2025 and is a significant resistance zone.
  • If the exchange rate encounters resistance and falls back in this area, it could reinforce market expectations of a “trend slowdown or even reversal.”
Short-term traders can pay attention to the price action of USD/JPY near the resistance zone, as well as subsequent signals from the Bank of Japan and the Federal Reserve.

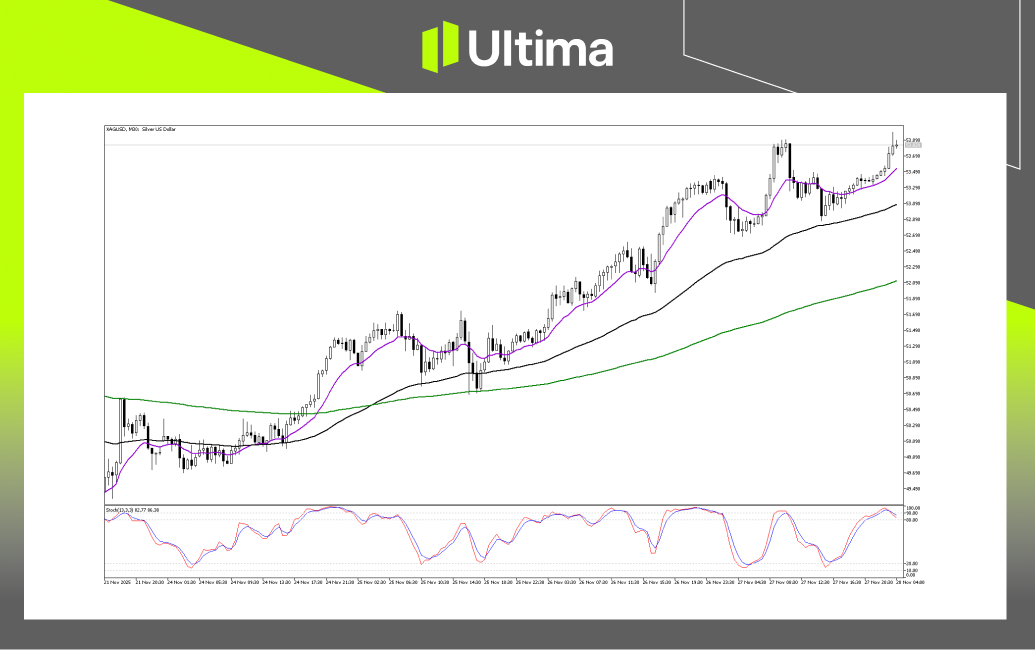
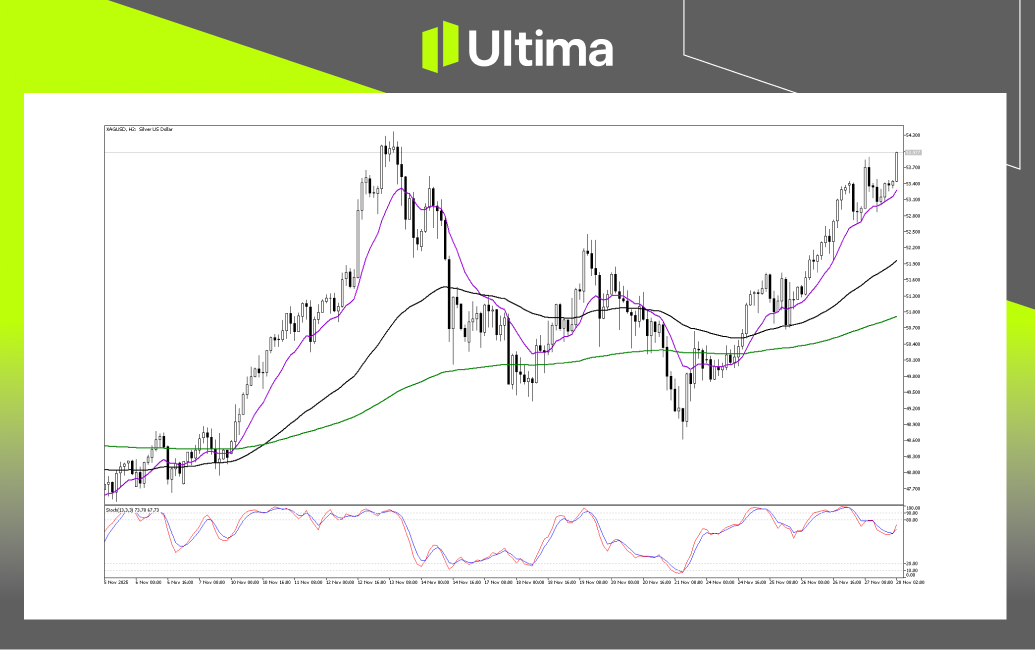
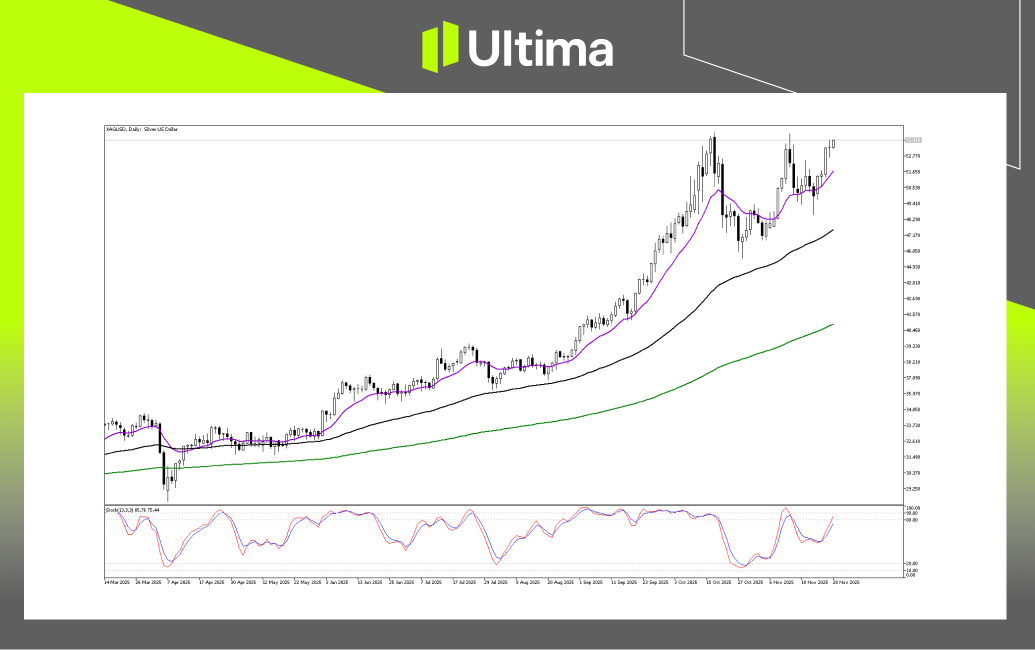
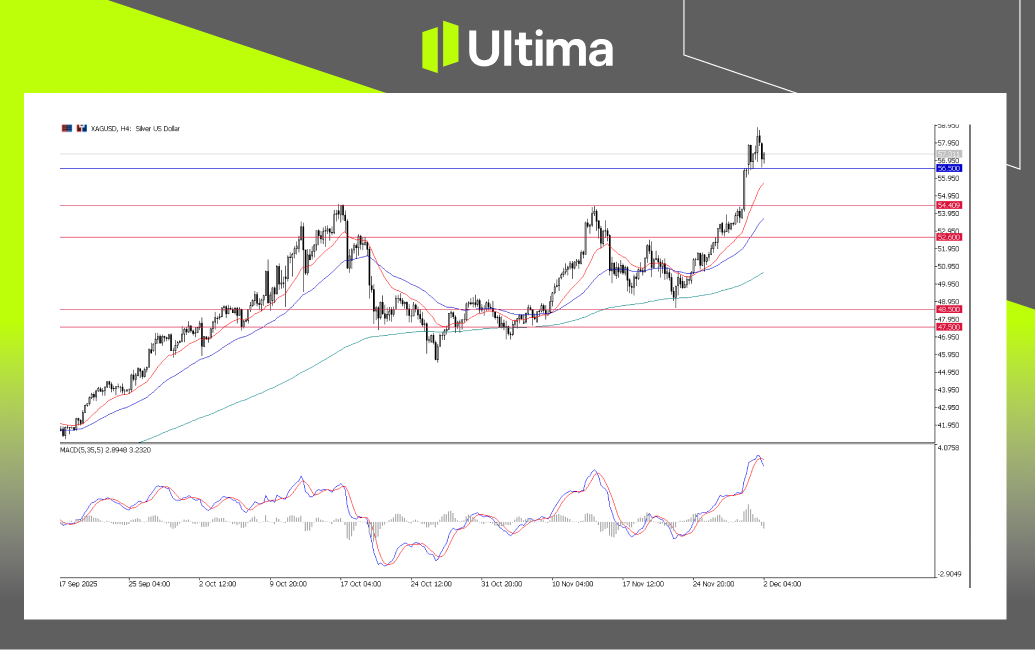
Silver: Momentum-driven rally after hitting a new all-time high


XAGUSD, H4 Chart | Ultima Market MT5

Silver is currently trading in a “vacuum” above $58 , with prices primarily driven by momentum and sentiment.
  • With no historical technical resistance above, the psychological level of $60 becomes the next target for the bulls.
  • Structural supply shortages and expectations of interest rate cuts remain the core of the bullish narrative.
The risk of a pullback should also be noted:
  • Key support levels in the near term are at 56.50 and 54.50.
  • A break below this level could indicate increased pressure for short-term bulls to take profits.

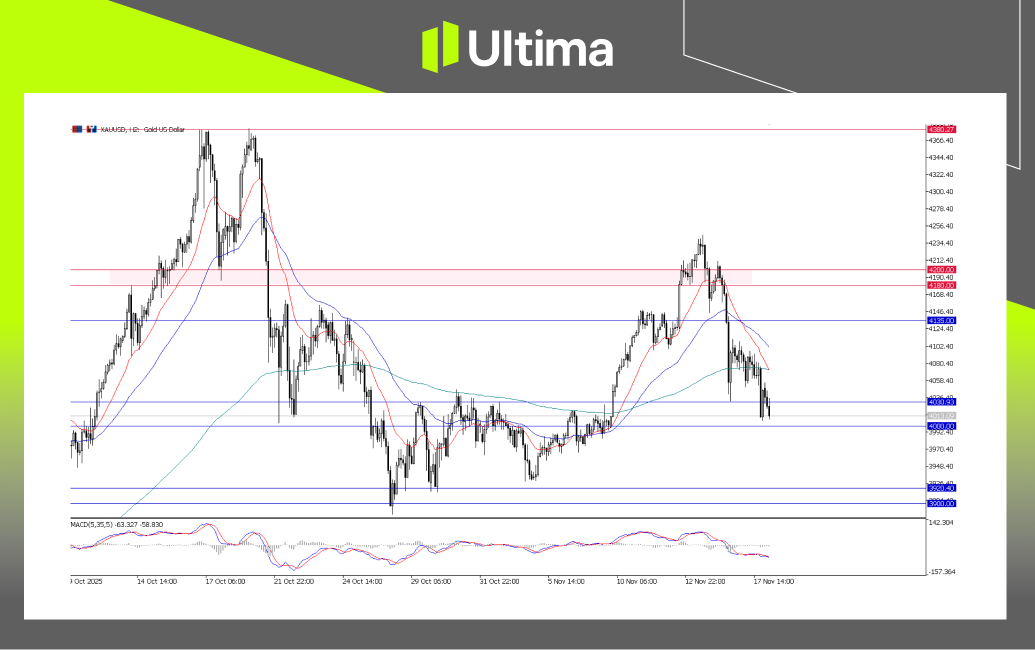
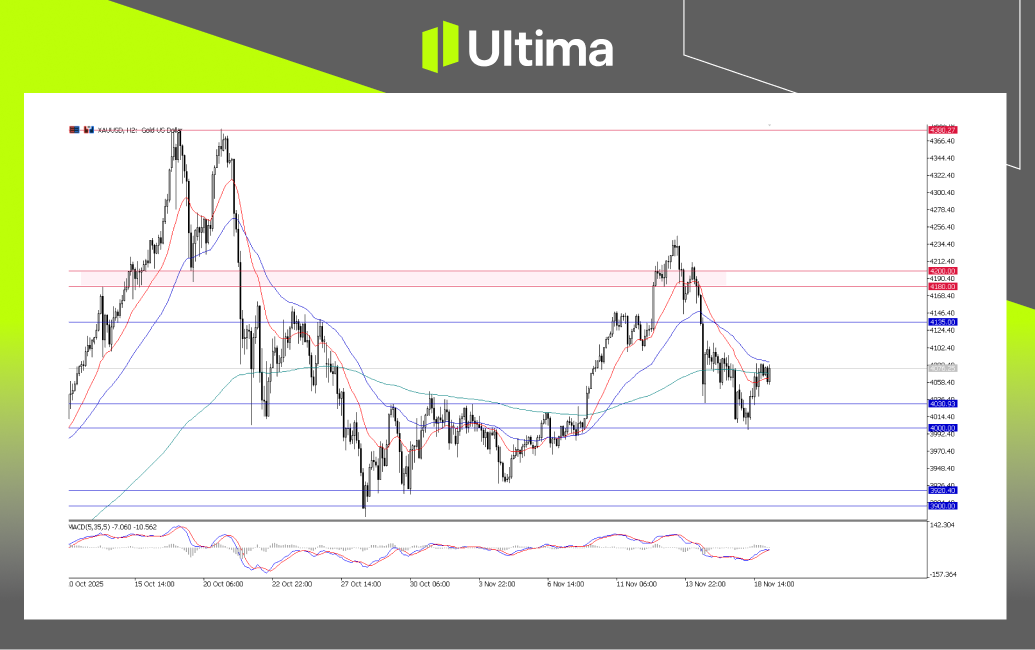
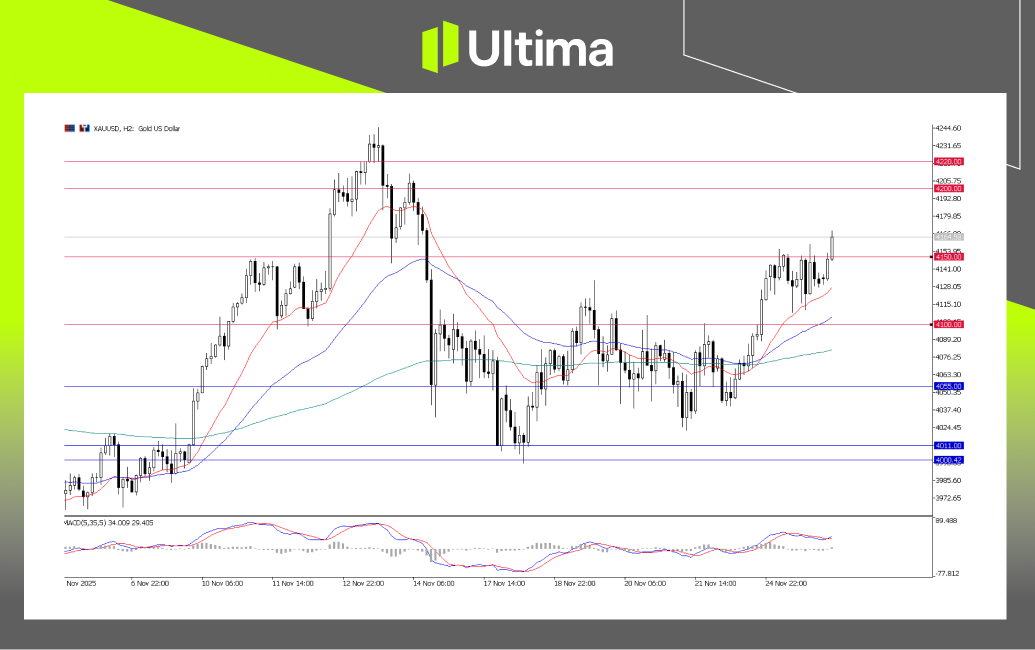
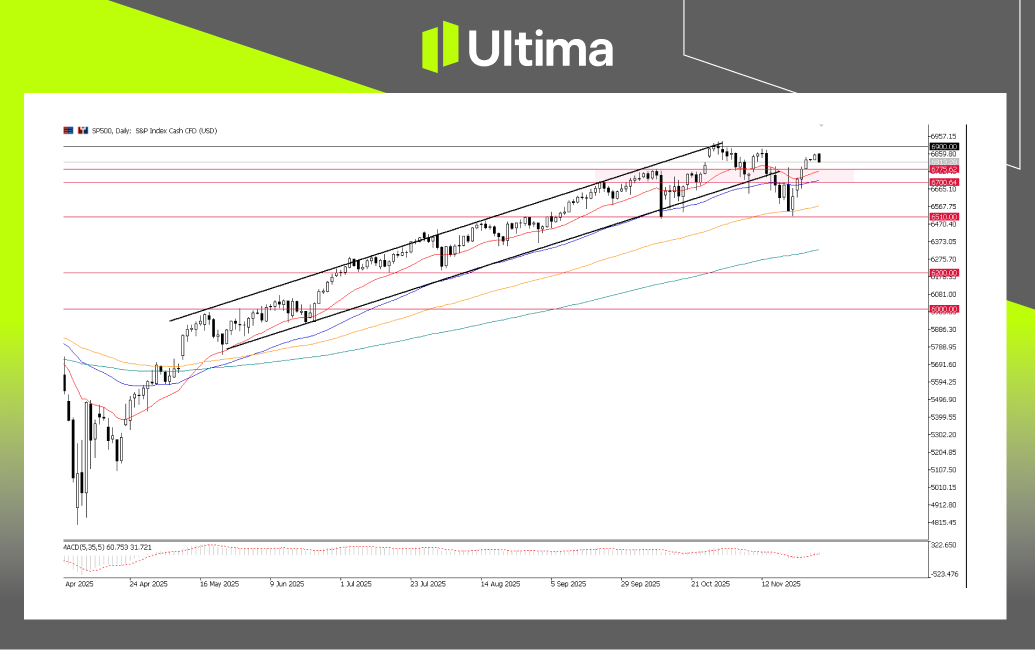
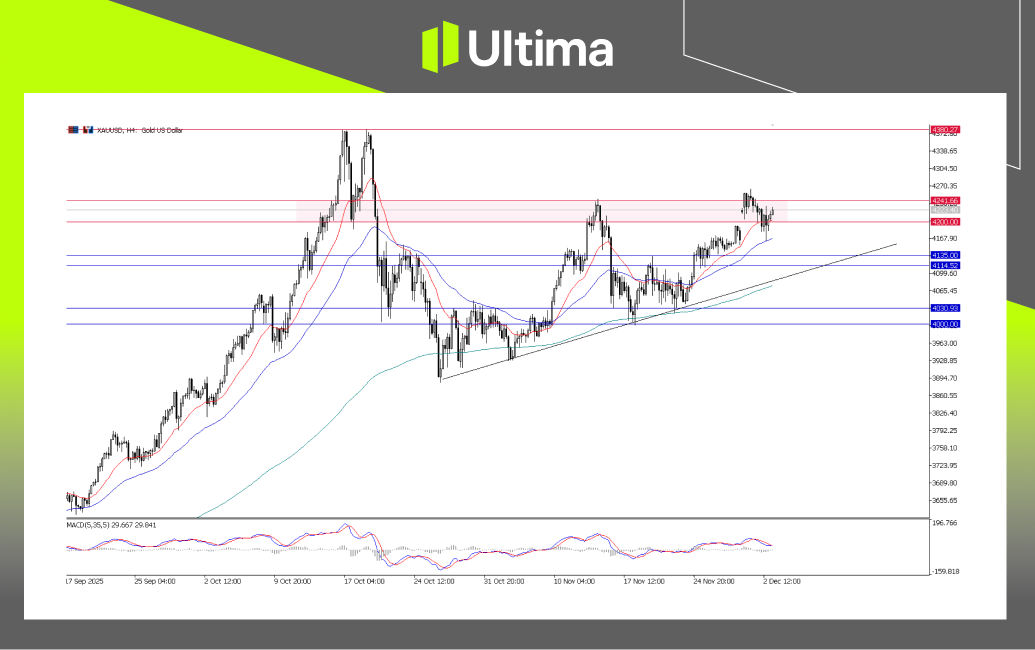
Gold: Finding a balance between easing expectations and risk sentiment

While silver became the market leader, gold also benefited:
  • Pricing
    the Fed’s rate-cutting cycle
  • Hedging demand against economic slowdown and policy uncertainty
Gold currently plays more of a “structural defensive asset” role. With a weaker dollar and expectations of declining real interest rates, it may still attract medium- to long-term buying on pullbacks.

Daily Market Summary

  • The US ISM Manufacturing PMI remained below 50, confirming industrial weakness, increasing the likelihood of a December rate cut, and supporting defensive assets.
  • The Bank of Japan’s hawkish stance has increased the likelihood of an interest rate hike, and expectations of a narrowing interest rate differential between the US dollar and Japan have grown, putting pressure on the USD/JPY exchange rate.
  • Silver hit a record high , becoming the leading commodity in this round of price increases, driven by supply shortages and speculative funds.
  • Gold remained stable, supported by risk sentiment and expectations of further easing; its upside potential depends on subsequent data and policy signals.
For traders, the key today is to track the USD/JPY’s reaction to policy divergences, assess a potential technical pullback in silver from its highs, and monitor gold’s support levels during the consolidation phase.

Disclaimer

The comments, news, research, analysis, prices, and other information contained herein are for informational purposes only and are intended to help readers understand market conditions. They do not constitute investment advice. Ultima Markets has taken reasonable steps to ensure the accuracy of the information, but cannot guarantee its absolute accuracy and it is subject to change without notice. Ultima Markets shall not be liable for any loss or damage (including, but not limited to, loss of profits) that may result from the direct or indirect use of or reliance on such information.
 

Risk appetite has rebounded strongly, prompting investors to actively “buy on dips”​

Market sentiment shifted rapidly from cautious to optimistic today. Despite a hawkish signal from the Bank of Japan earlier this week, strong expectations for a December rate cut by the Federal Reserve once again dominated fund flows, driving a broad-based rebound in risk assets, including US stocks, Bitcoin, and gold.

The impact of the Bank of Japan’s hawkish stance quickly subsided.

At the opening of trading on Tuesday, Bank of Japan Governor Kazuo Ueda hinted that a rate hike might be possible in December if inflation accelerates , briefly triggering market volatility.
  • A stronger yen put pressure on global stock markets.
  • Investors are worried that the era of ultra-low interest rate financing (carry trade) in Japan may be coming to an end.
But the market quickly repriced. Traders realized that even with Japan tightening its policies, the US-Japan interest rate differential remained significant , while the Federal Reserve was moving towards easing, and the overall interest rate differential structure still favored risk assets.

In other words, the dovish narrative in the United States outweighed the hawkish signals in Japan , significantly limiting downward pressure.

Risk assets rebound across the board, and “Federal Reserve protection” is playing out again.

After the panic subsided, funds flowed back strongly into risky assets, triggering a robust rebound:
  • U.S. stocks continued their upward trend :
    Wall Street chose to ignore the weak industrial sector, interpreting the earlier weak manufacturing data as “bad news is good news”—the economic slowdown means that the Federal Reserve will have more difficulty delaying easing, pushing the S&P 500 and Nasdaq higher.
  • Bitcoin V-shaped rebound (BTCUSD) :
    After the liquidity panic, Bitcoin quickly rallied in a V-shape, regaining its footing above the key support zone, indicating that risk appetite and speculative liquidity remain ample, with the market betting on a Fed rate cut in advance .

    [BTCUSD, H4 Chart | Ultima Markets MT5]
  • Bitcoin’s V-shaped rebound indicates that bulls actively entered the market after Monday’s sell-off.
  • The 86,000–90,000 range has now become a key support level, and we will use it to observe whether this rebound can continue.

Policy Outlook: Interest Rate Cut Expectations “Basically Formed”

Behind this rebound is the market’s increased confidence in short-term policy easing

Following the release of weak manufacturing data, the market has almost fully priced in a rate cut at next week’s FOMC meeting .
  • The consensus is that, given the significant pressure on industry, the Federal Reserve is unlikely to delay further easing measures.
  • Expectations of interest rate cuts have become the core driver of the rise in stocks, Bitcoin, and gold.
However, this optimism also comes with significant risks:
  • The delayed release of the PCE price index (a measure of inflation favored by the Federal Reserve) will be available on Friday.
  • If PCE unexpectedly overheats, it could quickly undermine the current rate-cutting trade.
Although the market is currently rising, sentiment remains highly sensitive to Friday’s inflation data.

Today’s Focus: ISM Services PMI

With the PCE data to be released soon, today’s ISM Services PMI serves as another key test of the policy outlook.
  • The US economy is primarily service-based, accounting for over 70% of GDP.
  • Investors can tolerate a temporary weakness in the manufacturing sector, but a full-blown weakening of the service sector is unacceptable.
Possible scenarios:
  • PMI above 50
    • Supporting the “soft landing” narrative: the economy is slowing but still stable.
    • This provides the Federal Reserve with room to cut interest rates in a relatively stable environment.
  • PMI falls below 50, entering contraction.
    • This suggests an increased risk of recession.
    • This could trigger profit-taking in the stock market, pushing up bond and gold prices.

Gold Outlook: Bulls hold $4,200, awaiting data direction

Gold (XAUUSD) has shown remarkable resilience despite global bond market volatility triggered by the Bank of Japan, holding firmly above the psychological level of $4,200 . Its future price movements will heavily depend on:
  • The trend of the US dollar index and US Treasury yields
  • Market repricing of the Fed’s December and next year interest rate path

    [XAUUSD, H4 Chart | Ultima Markets MT5]
From a technical perspective:
  • Gold remains in an overall bullish structure, and the recent pullback is considered a consolidation at higher levels.
  • The near-term resistance zone is between $4,200 and $4,240.
    • If the breakout is successful, the momentum could propel the price back towards the historical high of around $4,380.
  • Key support levels are at $4,130–$4,100.
    • As long as this area holds, the bullish structure remains intact.

Daily Market Summary

  • The market has once again chosen to trust “Fed liquidity” rather than hawkish threats from Japan.
  • “Bad news is good news” trading returns: Weakening manufacturing → Increased chances of interest rate cuts → Benefiting stocks and Bitcoin
  • Today’s ISM Services PMI is a key test of whether the soft landing story can continue.
  • Despite high optimism, this rebound remains quite fragile ahead of Friday’s PCE inflation data release.

Disclaimer

The comments, news, research, analysis, prices, and other information contained herein are for informational purposes only and are intended to help readers understand market conditions. They do not constitute any investment advice. Ultima Markets has taken reasonable steps to ensure the accuracy of the information, but cannot guarantee its completeness or timeliness. Content is subject to change without notice. Ultima Markets shall not be liable for any loss or damage (including, but not limited to, loss of profits) that may result from the direct or indirect use of or reliance on the information contained herein.
 

PCE Price Index Becomes Market Key, U.S. Dollar Risk Reversal​

Today’s main market focus centers on the delayed September PCE Price Index, which will be the critical indicator driving market movement this week following mixed labor market data. As market expectations for a December rate cut by the Federal Reserve intensify, the U.S. Dollar Index faces reversal risks, especially as conflicting labor market signals prompt investors to re-evaluate the policy path.

Mixed Labor Market Signals: ADP Job Loss vs. Low Claims

Another focus point today is the recently released ADP Employment Report, which showed a reduction of 32,000 private sector jobs, amplifying market expectations for a December rate cut by the Federal Reserve. However, Initial Jobless Claims fell to 191,000, reaching a low not seen in years, indicating that the labor market remains tight and resilient.

Such contradictory data creates uncertainty regarding the future direction of the labor market, making the PCE data a crucial indicator for gauging any potential shift in the Federal Reserve’s policy.

PCE Data Details: Core PCE Inflation Trend is Key

The September PCE Price Index is the final crucial data point before the Federal Reserve’s December meeting, essential for assessing the health of the U.S. economy. Markets are specifically focused on the Core PCE Index, the inflation data excluding food and energy:
  • Core PCE Year-over-Year (YoY): 2.9% (holding steady with the previous month)
  • Core PCE Month-over-Month (MoM): 0.2% (holding steady with the previous month)
If the Core PCE shows a continuous slowdown to below 2.9%, the Federal Reserve would gain more confidence to proceed with the December rate cut plan. Conversely, if PCE unexpectedly rises, it could overturn the current market expectations for a rate cut and significantly impact the U.S. Dollar, equities, and risk assets.

U.S. Dollar Index: Forming Double Top, Facing Downside Pressure

The U.S. Dollar Index (USDX) is currently forming a clear double-top pattern, and the market is watching the support level around 99.00. A breakdown below this area would confirm the bearish structure, potentially accelerating the dollar’s downside risk.
  • If the PCE data turns out softer, it may exacerbate the current negative sentiment, and the dollar could weaken further.
  • If the PCE data turns out stronger than expected, the dollar could quickly break above 99.00 and resume an uptrend.

USDX, H4 Chart Analysis | Ultima Markets MT5

Canadian Employment Data: Key for CAD Direction

Despite the PCE data being the main focus today, the Canadian Employment Report is also critical. Canadian job growth is expected to remain modest, with the unemployment rate anticipated to rise slightly to 7%, and employment change projected between 0-10K. Stronger-than-expected data could positively impact the Canadian Dollar (CAD).

Today’s Market Summary

  • Fed Rate Cut Expectations are intensifying, with the ADP employment data showing job contraction, driving the market’s repricing of Fed policy.
  • The U.S. Dollar faces pressure from a double-top formation; market movement will be dictated by the imminent PCE data release.
  • The Canadian Employment Report suggests a potential boost for the CAD, indicating that USD/CAD faces further downside pressure in the short term.

USDCAD, H4 Chart | Ultima Markets MT5

Disclaimer Comments, news, research, analysis, price, and all information contained in the article only serve as general information for readers and do not suggest any advice. Ultima Markets has taken reasonable measures to provide up-to-date information, but cannot guarantee accuracy or completeness, and the content may be modified without notice. Ultima Markets will not be responsible for any loss or damage incurred due to the direct or indirect use or reliance on the information provided herein.
 
Back
Top