Daily Market Analysis from Investizo

General analysis USDCAD for 13.06.2022

Current Dynamics.


The USD/CAD pair rose at the beginning of todays trading session. The pair continued to maintain its gains for the fourth consecutive session.

Some may refer the main reason for the rise of the US dollar to the recent macroeconomic data, which showed the great inflationary pressures facing the US economy, which increased expectations that the Federal Reserve will accelerate the pace in raising interest rates at a faster pace in the upcoming meetings to hold down inflation.

The data of the US Census Bureau showed that the consumer price inflation index in the country rose on a monthly basis by 1% during last May, exceeding expectations for an increase of 0.7%, and the index rose by its basic value when excluding energy and food prices by 0.6% last month, exceeding expectations for a 0.5% increase.

On an annual basis, the US consumer price index rose 8.6% on an annual basis in May, the highest level since 1981, and exceeded expectations for a rise of 8.3%.

Commenting on the latest economic data, former US Treasury Secretary Lawrence Summers said that the Federal Reserve had failed to correct its mistakes on inflation, which damaged its credibility, after the recent inflation data ended hopes for a peak. Summers warned of the Federal Reserve’s delay in raising the interest rate to control inflation, noting that discussions should be about raising interest rates between 50 to 75 basis points in the coming period. Besides that, US President Joe Biden said, “We will live with this inflation for a while, it will gradually decrease, but we will live with it for a while.”

Besides the statements, the numbers confirm that US inflation has not reached its peak yet, and that the Federal Reserve, which has committed to raise interest rates at each of its next two meetings, starting next week, will have to maintain this hawkish attitude during its September meeting.

In view of the most important events that may affect the performance of the pair, the US macroeconomic data will be present and strongly through the Producer price index for the month of May, along with the most important event which is the interest rate decision by the Federal Reserve.

Support and resistance levels.

On the 4-hour chart, the instrument is trading on the upper side of the Bollinger Bands. As the price range expands, indicating that the instrument is in an uptrend. The momentum chart is above the 100 level, which gives sell signals. The Envelopes indicator gives clear buy signals.

✔️ Support levels: 1.27925, 1.27625, 1.27225.
✔️ Resistance levels: 1.28395, 1.28700, 1.29200.

Trading scenarios

✔️ Long positions should be opened at the 1.27925 with a target of 1.28395 and a stop loss at 1.27625. Implementation period: 1-2 days.
Short positions can be opened at the level of 1.27625 with a target of 1.27225 and a stop-loss at the level of 1.27925. Implementation period: 1-2 days.


cad.jpg.6d9529561acc56e348a4690ac82fca05.jpg


Analytical department investizo

Disclaimer:
This material is provided as a general marketing communication for information purposes only and does not constitute an independent investment research. Nothing in this communication contains, or should be considered as containing, an investment advice or an investment recommendation or a solicitation for the purpose of buying or selling of any financial instrument.
 
General analysis AUDUSD for 14.06.2022

Current Dynamics


The Organization for Economic Cooperation and Development warned that the Reserve Bank of Australia might need to increase interest rates more aggressively. The Commonwealth Bank of Australia predicted a sharp decline of housing prices. The U.S. dollar index hit a 20-year high. U.S. consumer sentiment fell to its lowest level since records began.
The Reserve Bank of Australia (RBA) may need to raise interest rates more aggressively to curb inflation, the Organization for Economic Cooperation and Development (OECD) warned. Also, the OECD declared that it expects the monetary rate will reach 2.5% by the end of 2023. The organization also warned that strong global inflationary pressures and a tight labor market pose an additional risk of higher inflation in Australia. Expect the Australian economy to grow by 4.2% in 2022, a little faster than the 4.1% growth rate projected in December but now expected to slower growth in 2023 to 2.5% instead of 3%. It is worth noting that the OECD believes that skilled migration will begin after the opening of international borders. Australia's engineering vacancy rate is growing by 97% in 12 months.
However, the Commonwealth Bank of Australia is now expecting house prices to fall by 18% as the RBA continues to increase interest rates to beat the highest inflation in 32 years. The RBA currently expects inflation in Australia to continue to increase and reach 6.25% by the end of the year.
Meanwhile, the U.S. dollar index rose above 105 points for the first time since December 2002. A rising U.S. dollar index means it is strengthening against a basket of currencies. Nevertheless, the U.S. Michigan Consumer Sentiment fell to 50.2, its lowest level since records began. Also, the Consumer Price Index (CPI) showed that prices increased 8.6% in May from a year earlier, which is the fastest annual jump since late 1981. U.S. consumers' assessment of their personal financial situation deteriorated sharply. Half of all U.S. consumers spontaneously mentioned gasoline during interviews, and 46% of consumers attributed their worsening estimates to inflation.
In the short term we should expect further strengthening of the U.S. dollar. However, in Australia, judging by the labor market, there is potential for industrial and mining growth, while in the U.S., on the contrary, a sharp increase in interest rates in order to deal with inflation may lead to a recession. The Fed's next Interest Rate Decision is Wednesday.

The U.S. Producer Price Index (PPI) MoM will be released at 14:30 (GMT+2) today.
Experts forecast an increase of 0.8%. Australia Westpac Consumer Sentiment will be released tomorrow at 02:30 (GMT+2) and later in the day at 22:00 (GMT+2), Fed Interest Rate Decision will be released. It is expected to be increased by 50 bps to 1.50%.
Support and Resistance Levels.

 AUD/USD fell below the key Fibonacci 23.6 level but failed to fix  below. The current trend is downward. RSI oscillator is below the 30 level.

✔️ Support levels: 0.6931,0.6829,
✔️ Resistance levels: 0.7345, 0.7265, 0.7163, 0.7098, 0.7047, 0.6996 

Trading scenarios

✔️ Short positions may be opened from the level 0.6996 with target 0.6931 and stop-loss 0.7047 Implementation period: 1-3 days
✔️ Long positions may be opened above the level of 0.7047 with target 0.7098 and stop-loss 0.6996 Implementation period: 1-3 days

aud.jpg.c030198afb57cee2affb4466ac053b5b.jpg


Analytical department investizo

Disclaimer:
This material is provided as a general marketing communication for information purposes only and does not constitute an independent investment research. Nothing in this communication contains, or should be considered as containing, an investment advice or an investment recommendation or a solicitation for the purpose of buying or selling of any financial instrument.
 
General analysis USDJPY for 15.06.2022

Current dynamics


USD/JPY consolidates around 135.000 amid silence before the announcement of the new key rate in the U.S.

Suspension of so rapid growth in the pair, which has overcome a mark of 135.500 the day before, probably due to falling U.S. Treasury yields and traders expecting the announcement of a new key rate later today.

In addition, there was positive macroeconomic news on Japan earlier today, with Core Orders for machinery production coming in at 10.8% for April versus expectations of -1.5% and 7.1% last month. Annual data for the same indicator was 19% against expectations of 5.3% and 7.6% last year, respectively. Thus, it seems that the cheap money policy so consistently pursued by the Bank of Japan is beginning to bring its dividends, causing positive expectations in the industrial area of the economy.

Also in this situation the Japanese stock markets showed decline, so Nikkei 225 and Topix decreased by about 0.6%. Companies related to the technology and energy sectors showed the biggest drop, amid difficulties with the logistics of technological components and rising oil prices. In such a difficult situation the growth of orders in machine-building is conditioned by persisting high domestic consumer demand and desire of economic agents to convert monetary savings into material goods.

At the same time, not the most favorable economic news was released in USA, in particular the US Dollar Index (DXY) showed decline from recent highs reflecting a similar drop in government bond yields.

The key interest rate hike expected by most analysts is 75 basis points. Thus on the pair it is expected continuation of a bullish trend, and, certainly, the further movement upwards cannot be avoided in a situation when the Bank of Japan is the only central bank of the largest economies in the world, continuing a soft monetary policy in the current circumstances.

In addition to the pairs fateful announcement of a new Fed key rate and FOMC statement today, USD/JPY traders should keep an eye on the following macroeconomic news that could affect further developments: Core Retail Sales Index, May Retail Sales and U.S. Crude Oil Stocks also today, annual export, import and trade balance in Japan tomorrow. 

Support and resistance levels

Alligator is hungry: its mouth is wide open, its jaw (blue line) is low under the lips and teeth (green and red lines), the instrument is in an uptrend. The nearest fractal above the alligators teeth (red line) is at 135.420. Awesome Oscillator (AO) and Accelerator Oscillator (AC) are both in the green area, the bars are close to the zero level, which is a strong confirmatory buy signal.

✔️ Resistance levels: 136.290, 135.890, 135.420.
✔️ Support levels: 134.410, 133.800, 133.240.

Trading scenarios

✔️ Short positions should be opened at the 134.410 with a target of 133.800 and a stop loss at 134.900. Implementation period: 1-2 days.
✔️ Long positions can be opened at the level of 135.420 with a target of 135.890 and a stop-loss at the level of 134.900. Implementation period: 1-2 days.


jpy.jpg.fb08b7e577d9947e641e31f1b8be5578.jpg


Analytical department investizo

Disclaimer:
This material is provided as a general marketing communication for information purposes only and does not constitute an independent investment research. Nothing in this communication contains, or should be considered as containing, an investment advice or an investment recommendation or a solicitation for the purpose of buying or selling of any financial instrument.
 
General analysis USDJPY for 17.06.2022

Current Dynamics.


Japanese farmers are going to cut rice production and start planting wheat and soybeans. Japan's leader said he would set up a working group to fight inflation. The second-largest foreign trade deficit in the history of observations recorded by the Ministry of Finance of Japan in May.
Japanese farmers are going to cut rice production and start planting wheat and soybeans, considering rising grain prices. As of today, 80 percent of the wheat and 90 percent of the soybeans needed for the country's population are bought abroad, for which prices have risen significantly. At the same time, rice consumption and prices in Japan have been declining since 1962 as Japanese lifestyles change and life expectancy declines.
Meanwhile, Japan's government has said that if import prices of wheat remain elevated after September, the government will hold meat prices down by offering compensation to producers to offset higher feed costs. This would reduce production costs for basic agricultural products by about 10 percent to counter rising fertilizer prices.
Along with this, Japanese Prime Minister Fumio Kishida said he would create a task force to fight inflation and stimulate wage growth.
Meanwhile, the second-largest foreign trade deficit in the history of monitoring was fixed by the Ministry of Finance of Japan in May at 2.38 trillion yen ($ 17.7 billion). It is worth noting that in some industries there is a significant reduction in exports. For example, Japan sold cars to China for 36.3% of the lower sum than it was in May 2021. In addition, the volume of exports of the equipment used in the production of microcircuits decreased. It is worth noting that the deficit has been observed for the 10th month in a row and is mainly due to the high cost of raw materials.
At the same time there was negative news in the US labor market and construction sector. U.S. Initial Jobless Claims totaled 229K in May and U.S. Building Permits decreased to 1.695M. 
The Bank of Japan is starting to be pressured by the Japanese government to take measures to fight inflation and stabilize the yen. In the U.S., there are negative signals in the labor market, which previously allowed the White House to speak about the strength of the U.S. economy.
 
Today at 05:00(GMT+2) will release the Bank of Japan Monetary Policy Statement and the Japan Interest Rate Decision. Later that day at 14:45(GMT+2) will be the U.S. Fed Chair Powell Speaks.
Support and Resistance Levels.

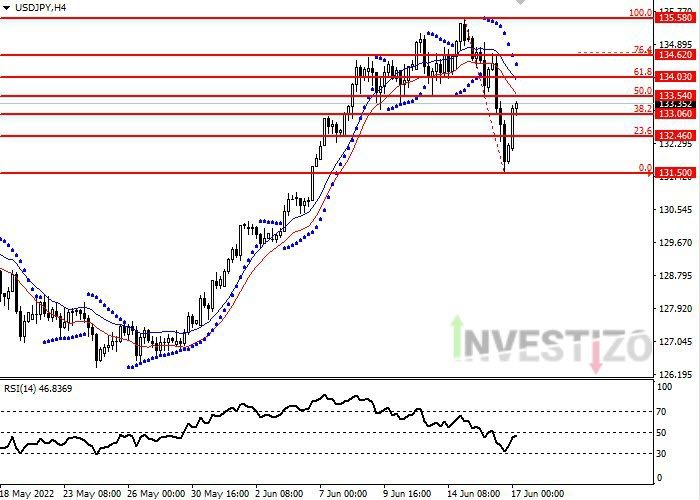
The USD/JPY returned to growth after a strong move lower and locked above the key Fibonacci 38.3 level. The current trend is upward. The RSI oscillator touched the 30 level and went up. The RSI oscillator is below 50.✔️ Support levels: 133.06, 132.46, 131.50
✔️ Resistance levels: 135.58, 134.62, 134.03, 133.54

Trading scenarios

✔️ Long positions can be opened above the level of 133.54 with a target of 134.62 and a stop loss of 133.06 : Implementation period: 1-3 days
✔️ Short positions may be opened below the level of 133.06 with a target of 131.50 and a stop loss of 133.54: Implementation period: 1-3 days

photo_2022-06-17_05-08-46.jpg.54a0c3962a4bf210a0f699e7cb93e04a.jpg


More analytics on our website

Analytical department investizo

Disclaimer:
This material is provided as a general marketing communication for information purposes only and does not constitute an independent investment research. Nothing in this communication contains, or should be considered as containing, an investment advice or an investment recommendation or a solicitation for the purpose of buying or selling of any financial instrument.
 
General analysis USDCAD for 21.06.2022

Current dynamics


The USD/CAD pair opened todays trading session with a decline. The Canadian dollar continued its gains for the second session in a row, after the pair reached its highest level at 1.30787 in last Fridays session.

Combined with the US holiday, the light calendar and traders hesitation about the next market moves, along with their fears of faster monetary policy tightening and an economic slowdown, all of this put downward pressure on the US dollar.

However, US Treasury Secretary Janet Yellens statements came to confirm that a recession is not inevitable in the United States, with expectations of a slowdown in the economy in the midst of its transition to slow and stable growth.

On the other hand, according to statements by members of the US Federal Reserve, the US Central Bank is determined to continue raising US interest rates without regard to fears of economic stagnation until US inflation stops its record rise.

A member of the US Federal Reserve and President of the St. Louis Federal Bank, James Bullard, expressed that more interest rate hikes are coming in the upcoming meetings, and assured that the economic expansion will continue in the current year, speaking about the labor market, saying that it is still solid, and indicates the strength of the US economy.

Over the weekend, Federal Reserve Board member Christopher Waller also said that he supports a 75 basis point rate hike in July if the data comes out as expected.

On the other hand, the US dollar index DXY is still extending the beginning of the week’s losses to 104.30, down 0.20%, while the 10-year US Treasury yields recorded a three-day bullish trend around 3.284%.

All eyes will be on as Federal Reserve Chairman Jerome Powell will testify in his semi-annual monetary policy report before the Senate on Wednesday and will repeat his statement before a different committee on Thursday, where market participants will look for clues about economic developments in the US.

Looking at the most important events that may affect the pair’s performance, on the American side, in addition to Jerome Powells statements on Wednesday and Thursday, there will also be a reading of the final consumer confidence in Michigan for the month of June, and this week we will also see the results of the existing home sales indicators, along with orders mortgage and initial unemployment benefits claims.

On the Canadian side, the retail sales data for the month of April will be significant on Tuesday, as core sales are expected to come in at 0.8%, up from 0.2% in March, while sales excluding cars are expected to come in at 0.6%, down from the previous 2.4% in March and the CPI for May, which is expected to come in at 0.4%, compared to 0.7% in April.

Support and resistance levels

On the 4 hour chart, the instrument failed to consolidate above the Bollinger Bands moving average. The indicator is directed downward and the price range has shrunk, indicating that the current trend is about to change.The momentum chart is above the 100 level, which gives sell signals. The Envelopes indicator gives buy signals.

Support levels: 1.30775, 1.30200, 1.29725.
✔️ Resistance levels: 1.29200, 1.28675, 1.28125.

Trading scenarios

Long positions should be opened at the 1.29200 with a target of 1.29725 and a stop loss at 1.281675. Implementation period: 1-3 days.
✔️ Short positions can be opened above the level of 1.28675 with a target of 1.28125 and a stop-loss at the level of 1.29200. Implementation period: 1-3 days.

usdcad.jpg.31fbfc324177f5b8601f49d655f423fd.jpg


More analytics on our website

Analytical department investizo

Disclaimer:
This material is provided as a general marketing communication for information purposes only and does not constitute an independent investment research. Nothing in this communication contains, or should be considered as containing, an investment advice or an investment recommendation or a solicitation for the purpose of buying or selling of any financial instrument.
 
General analysis Brent for 22.06.2022

Current Dynamics


The head of the U.S. Treasury revealed the mechanism for reducing Russia's oil revenues. After another increase of selling prices the head of Petrobras resigned. In the UK, fuel prices set a new record against the background of the largest railway workers' strike. Saudi Arabia increased oil production in April on 1.4%. The Indian Government called upon the state companies to buy larger volumes of crude oil from Russia.
The head of the US Treasury Department, Janet Yellen, said that the initiative, which is being worked out by the USA and its allies, is called to increase the supplies of Russian oil to the global market and at the same time to reduce its cost.  The countries are considering the possibility of introducing a price limit or exclusion that would reduce the price of Russian oil and limit Russia's revenues, while allowing more oil to enter the market. Such measure will allow the European companies to insure the Russian oil. It is worth noting that Canada and the U.S. admit that rejecting oil from Russia is a "more difficult" situation for Europe.
Meanwhile, Petrobras on Friday announced another increase in selling prices. The cost of diesel fuel for distributors increased on 14.26% and gasoline rose on 5.18%. After which the head of the Brazilian national oil and gas company Petrobras Jose Mauro Coelho resigned.
Against the backdrop of a strike of railway workers in the UK, fuel prices set new records. According to the car service company RAC, on average 1 liter of unleaded gasoline cost £1.887 and diesel fuel - £1.961. Is worth noting that over the year the average cost of gasoline in the kingdom has grown on 45% and diesel fuel - 48%.
Meanwhile, Saudi Arabia in April increased oil production by 1.4%. In annual terms, the value jumped on 28.4%. Exports rose 2% to 7.382 million barrels per day (bpd), 36.5% higher than April 2021. 
However, Russia displaced Saudi Arabia from the first place in the list of the main suppliers of oil to China. Russian oil shipments to China totaled nearly 1.98 million b/d in May, which is 25% more than in April and 55% more than in May 2021.
At the same time, the Indian government strongly recommends its state companies to buy "large volumes" of crude oil from Russia with a discount. It is worth noting that during the period from May 27 to June 15, India has increased its purchases of Russian oil by 31 times compared to the same period a year ago.
While there are changes in logistical chains, the deficit of oil will have an effect, but the impending economic crisis and the risk of recession may lead to a reduction in demand for oil.

Today at 22:30 (GMT+2) the American Petroleum Institute (API) will release data on weekly U.S. crude oil inventories. The Energy Information Agency (EIA) will release data on crude oil inventories tomorrow at 17:00 (GMT+2). Inventories are expected to decline by 1.433M.
Support and resistance levels.

Brent has broken through the key Fibonacci 50.00 level. RSI oscillator is near the 30 level.

✔️ Support levels: 107.30, 10360, 97.40
✔️ Resistance levels: 123.25, 117.20, 113.35, 110.30

Trading scenarios

✔️ Long positions can be opened from the current level with a target of 117.20 and a stop loss of 107.20. Implementation period: 2-4 days
✔️ Short positions may be opened below the level of 107.20, with a target of 103.60 and a stop loss of 110.30. Implementation period: 2-4 days

photo_2022-06-22_05-47-46.jpg.e5b8df0d0ecf29b3345998f4564ce10a.jpg

More analytics on our website

Analytical department investizo

Disclaimer:
This material is provided as a general marketing communication for information purposes only and does not constitute an independent investment research. Nothing in this communication contains, or should be considered as containing, an investment advice or an investment recommendation or a solicitation for the purpose of buying or selling of any financial instrument.
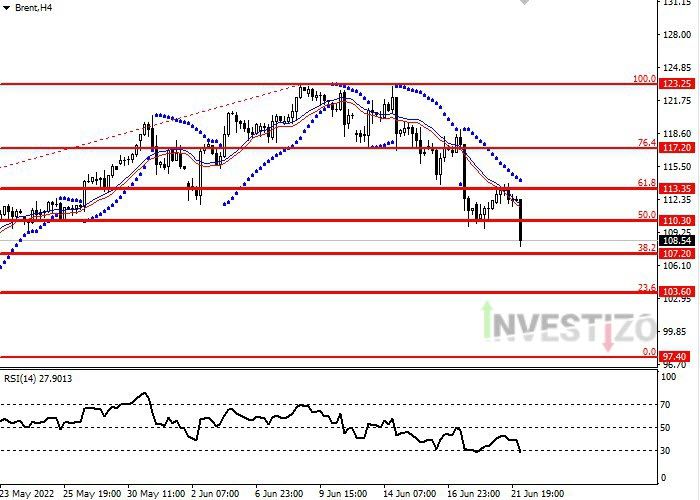
 
General analysis AUDUSD for 22.06.2022

Current dynamics


The AUD / USD pair is still subjected to selling pressures, as it witnessed a strong decline in the beginning of today's trading.The decline came to continue the Australian dollar losing its gains last week, which came after the Reserve Bank of Australia announced an interest rate hike.  

In addition to the weak investor appetite for risk, some may attribute the main reason for the increase in the demand for the dollar to the optimistic view by investors that the US Federal Reserve will stick to its tightening policy, raising interest rates at a faster pace to combat high inflation following the statements of the Fed members. 
US Federal Reserve member Thomas Barkin said that the Fed should raise interest rates as quickly as possible without breaking anything. We expect that message to be delivered again today when Powell delivers his semi-annual testimony before the Senate. 
Also Christopher Waller, a member of the US Federal Reserve, added that he supports another increase in interest rates by 75 basis points at the central bank meeting in July if economic data emerges as he expects. 
On the other hand, the US dollar index rose 0.4% at 104.83, coinciding with a limited decline in the yield on US Treasuries, which are trading near their highest levels in 11 years, as the yield on 10-year Treasuries reached 3.23%, and US home sales fell increased by 3.4% to 5.41 million in May 2022, the lowest level since June 2020.
Looking ahead and the scarcity of economic data on the Australian side, market investors' eyes will now turn to Fed Chairman Jerome Powell's semi-annual testimony before the Senate Banking Committee, scheduled for later during the North American session, in addition to his testimony on Thursday before the Joint Economic Committee in Washington. Support and resistance levels

On the 4 hour chart, the instrument is holding onto the moving downside of the Bollinger Bands. The indicator is directed downward and the price range has widened, indicating that the current trend is about to continue. The momentum chart is below the 100 level, which is giving buy signals. The Envelopes indicator gives clear sell signals.

✔️ Support levels: 0.69075, 0.68525, 0.68000.
✔️ Resistance levels:0.69600, 0.70100, 0.70700.

Trading scenarios

✔️ Short positions should be opened at the 0.69075 with a target of 0.68525 and a stop loss at 0.69600. Implementation period: 1-3 days.
✔️ Long positions can be opened at the level of 0.69600 with a target of 0.70100 and a stop-loss at the level of 0.69100. Implementation period: 1-3 days.

photo_2022-06-22_16-59-09.jpg.97d617e2841a9a566fac5709ee9a6670.jpg

More analytics on our website

Analytical department investizo.com

Disclaimer:
This material is provided as a general marketing communication for information purposes only and does not constitute an independent investment research. Nothing in this communication contains, or should be considered as containing, an investment advice or an investment recommendation or a solicitation for the purpose of buying or selling of any financial instrument.
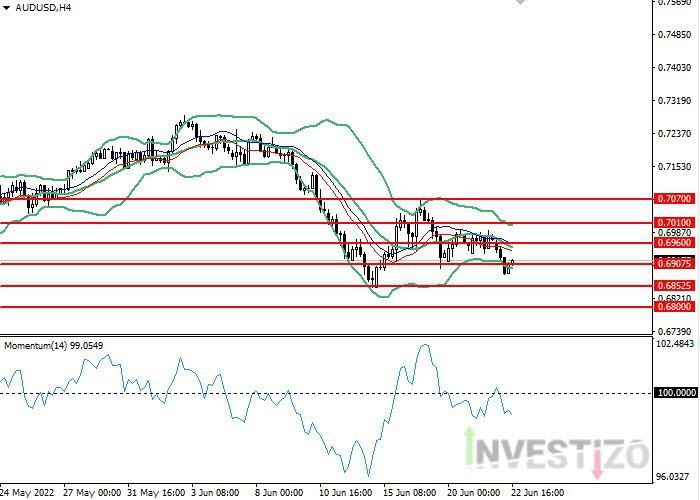
 
General analysis USD/CHF for 24.06.2022

Current Dynamics


The USD/CHF pair opened lower at the beginning of todays trading session. The pair lost all of its gains in the second half of yesterdays session, continuing the bearish performance from mid-June.

The pairs losses came after Federal Reserve Chairman Jerome Powells statements yesterday, Thursday, during his statement before the US Senate Banking Committee, regarding the possibility of the economy being exposed to a recession during his effort to suppress inflation.

Where Powell stated that the central bank is not trying to create an environment that pushes towards a recession, but it is certainly possible, given the recent global events, especially the Russian-Ukraine war and the Covid-19 pandemic, which made it more difficult to hold down inflation without side effects. He added that the major goal for them is to achieve a safe drop in inflation rates, but the path to this goal has many challenges, and that the Central Bank is committed to controlling inflation and has the tools to achieve this goal. As Fed Member Michael Bowman added on Thursday, she supports a 75 basis point rate hike in July followed by 50 basis point increases in the next few meetings.

On the other hand, US unemployment data was released and recorded 229 thousand unemployment claims, while experts expected to receive 227 thousand unemployment claims, and the previous reading recorded 231 thousand unemployment claims, and the manufacturing purchasing managers index returned to the lowest level in two years, about 52.4 points during this June, less than expected growth by 56.0 points, and the previous reading declared 57.0 points last May. The preliminary reading of the Services Purchasing Managers Index also showed a negative reading of 51.6 points, less than the market expectations that announced the index’s growth by 53.5 points during the same period, and the previous reading recorded a growth of 53.4 points during last May.

In addition, S&P 500 futures declined 0.30% while US 10-year Treasury yields remained unchanged at around 3.09% after dropping to a two-week low the previous day.

Looking at the most important events affecting the pair, investors attention will be directed to the US macroeconomic data represented in new home sales for the month of May, as well as the Michigan consumer confidence index.

Support and resistance levels.

On the 4 hour chart, the instrument is holding onto the moving downside of the Bollinger Bands. The indicator is directed downward and the price range has widened, indicating that the current trend is about to continue. The momentum chart is below the 100 level, which is giving buy signals. The Envelopes indicator gives clear sell signals.

✔️ Support levels: 0.95900, 0.95550, 0.95175.
✔️ Resistance levels: 0.96375, 0.96775, 1.0650, 0.97325.

Trading scenarios

Short positions should be opened at the 0.95550 with a target of 0.95175 and a stop loss at 0.95900. Implementation period: 1-2 days.
✔️ Long positions can be opened above the level of 0.95900 with a target of 0.96375 and a stop-loss at the level of 0.95550. Implementation period: 1-2 days.

[IMG]

More analytics on our website

Analytical department investizo

Disclaimer:
This material is provided as a general marketing communication for information purposes only and does not constitute an independent investment research. Nothing in this communication contains, or should be considered as containing, an investment advice or an investment recommendation or a solicitation for the purpose of buying or selling of any financial instrument.
 
General analysis USDJPY for 27.06.2022

Current Dynamics


Growth in manufacturing activity in Japan slowed in June. Sales at Japanese department stores increased for the third month in a row. Political parties in Japan are focusing on raising wages for citizens in their pre-election campaigns. IMF supports the U.S. Federal Reserve's decision to increase the benchmark interest rate up to 3.5-4%
Growth in manufacturing activity in Japan slowed in June. It is worth noting that overall new orders declined for the first time in nine months because of increasing pressure on already disrupted supply chains, while output is growing at its slowest pace in 3 months.
At the same time, department store sales in Japan have increased for the third month in a row. Sales are up 57.8% compared to 2021. Consumer demand for luxury goods such as precious metals and jewelry has revived along with high demand for summer clothing. However, sales were lower on 10.5 % compared to three years ago.
Meanwhile, within the framework of pre-election race political parties in Japan put measures aimed to raise the minimum wage, as well as tax benefits at the forefront of their campaigns.
It is also worth noting that Japan's first central government has issued a warning about energy shortages. Japanese government asks citizens to make efforts to save electricity, especially from 15 to 18 hours.
Meanwhile, the International Monetary Fund supports the U.S. Federal Reserve's policy of raising the benchmark interest rate to 3.5-4% to fight high inflation.  The Fund forecasts U.S. GDP will reach 1.7% this year and 0.8% in 2023. According to the Fund, the inflation will reach 5.4% at the end of this year and in 2023 it will be around 2%.  It also follows from the IMF statement that the USA has less and less chance to avoid recession. It should be reminded that the inflation rate in the USA is now fixed on the level of 8.6%.
A weak yen makes Japanese industry a more attractive place to invest, but further weakening could severely lower the purchasing power of the Japanese. At the same time, the US will continue to tighten its monetary policy but it could lead to a recession and further manufacturing shutdowns.
 
Today at 07:00(GMT+2) will be released Japan Leading Index MoM, Japan Leading Index MoM, Japan Coincident Indicator MoM later in the day at 14:30(GMT+2) will be released U.S. Core Durable Goods Orders MoM and at 16:00 (GMT+2) will be released U.S. Pending Home Sales MoM.
Support and resistance levels.

The USD/JPY fell below a key Fibonacci 38.2 level on Monday. The RSI oscillator is below 50.

✔️ Support levels: 134.70, 134.10, 133.50, 132.73, 131.50

✔️ Resistance levels: 136.70, 135.45,

Trading scenarios

✔️ Short positions can be opened from the current level with a target of 133.50 and a stop loss of 135.45 : Implementation period: 1-3 days
✔️ Long positions can be opened above the level of 135.45 with target 136.70 and stop-loss 134.10: Implementation period: 1-3 days

jpyh4.jpg.0df24510d5cb23503c4081b0517d5dde.jpg

More analytics on our website

Analytical department investizo

Disclaimer:
This material is provided as a general marketing communication for information purposes only and does not constitute an independent investment research. Nothing in this communication contains, or should be considered as containing, an investment advice or an investment recommendation or a solicitation for the purpose of buying or selling of any financial instrument.
 
General analysis EURUSD for 28.06.2022

Current Dynamics


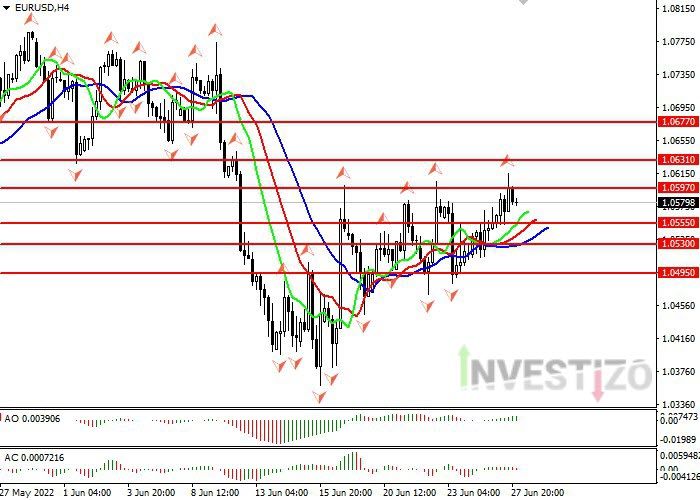
The EUR/USD is heading down from two-week highs to a support level at 1.05800

The EUR/USD failed to break through the resistance level around 1.06000 amid fears of economic recession and upward trends in Eurozone inflation indicators, and at the moment the pair is declining in correction, trading in flat at the nearest support level, formed over the last two weeks around 1.05800.

The latest rise in the pair was caused by the bulls positive expectations for the further growth in quotations because of the ambiguous macroeconomic data on the USA along with the coming hypothetical increase in the key rate by the European Central Bank.

On the European side, the reason for the pair to enter the correction, most likely, is the factor of the geopolitical tension caused by the armed conflict in Ukraine. Thus, the rhetoric of the Russian Federation representatives in response to the announcement of the technical default and prohibition of the transit of critical economic resources by the Lithuanian government causes a natural pressure in Western Europe. Among other things, it is much more difficult for European countries in the current situation to cope with disruptions in production supply chains than it is for the United States.

On the greenback side the reasons for the current trend are the following positive data that came out yesterday and pleased the bulls on the US dollar: The volume of durable goods orders for May rose much stronger than expected - 0.7% against the expected 0.1% and the previous 0.4%. A similarly strong data release was also seen in the Pending Home Sales Index for May, also 0.7%, but this time the gap with the expected number was even bigger (-3.7% vs. -4.0% for the previous month). However, this is just local good news for the North American economy as the stock market continues its decline and Treasury yields continue to rise.

The macroeconomic news, is to be published soon and which may affect further movements of the pair, are the speeches of ECB Chairman Lagarde and ECB representatives Lane, Elderson and Panetta. On the US side is the Consumer Confidence Index for June. The above data will be released later today.

Support and resistance levels.

Alligator is hungry: its mouth is wide open, its jaw (blue line) is low under the lips and teeth (green and red lines), the instrument is in an uptrend. The nearest fractal above the alligators teeth (red line) is at 1.05970. Awesome Oscillator (AO) and Accelerator Oscillator (AC) are both in the green area, the bars are close to the zero level, which is a strong confirmatory buy signal.

✔️ Support levels: 1.04950, 1.05300, 1.05550

✔️ Resistance levels: 1.05970, 1.06310, 1.06770

Trading scenarios

✔️ Short positions can be opened from the level of 1.05550 with a target of 1.05300 and a stop loss of 1.05750: Implementation period: 1-3 days
✔️ Long positions can be opened from the level of 1.05970 with a target of 1.06310 and stop-loss of 1.05750: Implementation period: 1-3 days


1078300568_eurusdh4.jpg.bd9a92a9002a88efa879fc9d7b37c9cd.jpg


More analytics on our website

Analytical department investizo.com

Disclaimer:
This material is provided as a general marketing communication for information purposes only and does not constitute an independent investment research. Nothing in this communication contains, or should be considered as containing, an investment advice or an investment recommendation or a solicitation for the purpose of buying or selling of any financial instrument.
 
General analysis USDCAD for 29.06.2022

Current dynamics


The USD/CAD pair witnessed a decline at the beginning of today's trading session. This is after a slight correction that the pair had witnessed in the second half of its session on Tuesday. After a two-day downtrend, during which it recorded its lowest level in two weeks at 1,28190.

Some may attribute the Canadian dollar's recent gains were supported by bullish crude oil prices, as Canada is the largest oil producer in the US, but US data, as well as geopolitical and trade talks, supported bullish hopes for the dollar.Rising fears of a recession put additional pressure on market sentiment and supported demand for the safe haven US dollar.

Despite this, Federal Reserve member James Bullard played down the possibility of a recession in the United States, and Bullard added that the process of reducing inflation could be painful but the FOMC must continue to raise interest rates to prevent inflation expectations from becoming more entrenched.

And as US Federal Reserve member John Williams stressed on Tuesday that he expects the US economy to avoid a recession, although he sees the need for the US Federal Reserve to raise interest rates more to control inflation.

On the other hand, the data of the Consumer Confidence Index issued on Tuesday by the Conference Board showed negative index data during the current June, as the data showed that the index recorded about 98.7 points, declining less than the expectations of the markets, which were about 100.0 points, and also less than the previous reading, which recorded 103.2 point during May.

Data published by the US Census Bureau on Tuesday revealed that the US international trade deficit narrowed by $2.4 billion to $104.3 billion in May from $106.7 billion in April. The data showed that exports of goods for the month of May amounted to 176.6 billion dollars, an increase of 2.0 billion dollars over April exports. Merchandise imports for the month of May amounted to $280.9 billion, down $0.4 billion from April's imports.

Looking at the most important events affecting the pair, besides Fed Chair Powell's speech, investors' focus will also remain on US core personal spending data for the first quarter of 2022, which is expected to remain unchanged at 5.1%. Along with the final readings for the first quarter GDP, which is likely to confirm an annual contraction of 1.5%.

Support and resistance levels

On the 4 hour chart, the instrument is testing a consolidation at the moving average of the Bollinger Bands. The indicator is directed downward and the price range is narrowing, indicating that the current trend is about to change. The momentum chart is below the 100 level, which is giving buy signals. The Envelopes indicator gives sell signals.

✔️ Support levels: 1.28425, 1.27850, 1.27175.
✔️ Resistance levels: 1.29075, 1.29725, 1.30450.

Trading scenarios

✔️ Short positions should be opened at 1.28425 with a target of 1.27850 and a stop loss at 1.28840. Implementation period: 1-3 days.
✔️ Long positions can be opened above the level of 1.29075 with a target of 1.29725 and a stop-loss at the level of 1.28425. Implementation period: 1-3 days.

cad.jpg.8e1de57ac66c36470d2e35e8a5f7ce21.jpg

More analytics on our website

Analytical department investizo

Disclaimer:
This material is provided as a general marketing communication for information purposes only and does not constitute an independent investment research. Nothing in this communication contains, or should be considered as containing, an investment advice or an investment recommendation or a solicitation for the purpose of buying or selling of any financial instrument.
 
General analysis USDCHF for 30.06.2022

Current dynamics


The USD/CHF pair managed to achieve some gains during today's trading session. Thus, the pair stopped losses that lasted for more than two weeks, taking advantage of the previous day's recovery from its lowest level since April.

The dollar's recent gains were supported by Federal Reserve Chairman Jerome Powell's statements during the European Central Conference, despite the release of weak economic data. Where Powell confirmed, that the economy is still maintaining its strength and is still coherent, while stressing the strength of the labor market in the United States of America, and that it is still able to absorb the developments of the current economic situation.He reiterated bets on tighter policy tightening to combat high inflation and underlined the Fed's ability to succeed in bringing inflation down to the 2% target while maintaining a strong employment pace.

In addition to the statements of the Fed members that the central bank will raise interest rates by 75 basis points at the next July meeting.

On the other hand, US macroeconomic data revealed that the final reading of the gross domestic product recorded a contraction in the first quarter of 1.6%, exceeding expectations of recording a contraction of 1.5%.

The stock markets on Wall Street witnessed a strong fall, as the Dow Jones index fell today, Thursday, in the pre-trading period of 1.2%, and the Nasdaq fell by 2%, while the Standard & Poor's 500 index fell in the range of 1.5%.

Where some may see, that the state of risk aversion on the part of investors as a result of the increase in recession fears and the rapid continuation of raising interest rates, as illustrated by the daily losses of US stocks, should serve as a tailwind for the dollar as a safe haven.

Key events in the US macroeconomics this week: PCE, Core PCE, Personal Income, Personal Spending Thursday, along with the manufacturing ism, the final manufacturing PMI tomorrow Friday.

Support and resistance levels

On the 4 hour chart, the instrument is testing a consolidation above the Bollinger Bands moving average. The indicator is directed sideways and the price range is narrowing, indicating that the current trend is about to change.The momentum chart is below the 100 level, which is giving buy signals. The Envelopes indicator gives sell signals.

✔️ Support levels: 0.95275, 0.94650, 0.94000.
✔️ Resistance levels: 0.95800, 0.96325, 0.96950.

Trading scenarios

✔️ Long positions should be opened at the 0,95800 with a target of 0.96325 and a stop loss at 0.95275. Implementation period: 1-2 days.
✔️ Short positions can be opened above the level of 0.95275 with a target of 0.94650 and a stop-loss at the level of 0,95800. Implementation period: 1-2 days.

CHF.jpg.371a5ac8ea52bb2558f4000861fedd34.jpg

More analytics on our website

Analytical department investizo

Disclaimer:
This material is provided as a general marketing communication for information purposes only and does not constitute an independent investment research. Nothing in this communication contains, or should be considered as containing, an investment advice or an investment recommendation or a solicitation for the purpose of buying or selling of any financial instrument.
 
General analysis GBPUSD for 01.07.2022

Current dynamics


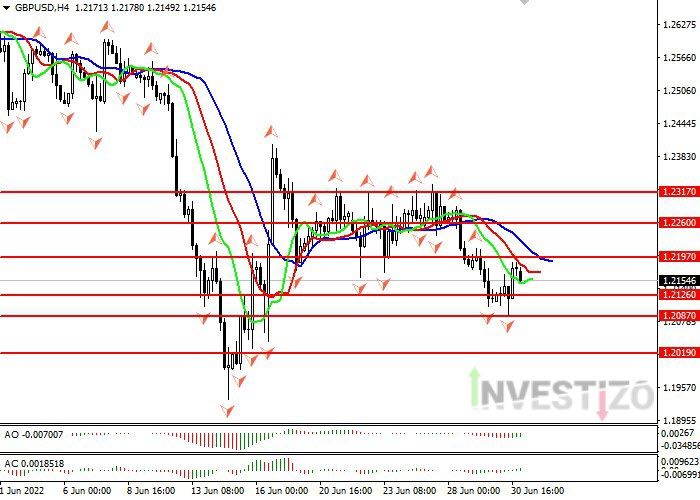
GBP/USD fluctuates around 1.21500 amid UK VAT rate debate and US macro news

GBP/USD after a week long decline failed to reach 1.22000 during yesterdays correction and the downtrend might continue in the near term, as a possible cut of the VAT rate might not be good for the GBPs price dynamics.

At the moment there is no decision to cut the VAT rate in the UK, and it seems that discussions on that prospect have not had a significant impact on the behavior of traders on the pair. According to Steve Barclay (Chief of Staff to the Prime Minister of Great Britain), cutting the VAT rate is likely to have a positive effect on the economic growth, to stimulate business activity and ease the burden on ordinary citizens and to reduce the risk of a general economic downturn.

Fresh data on the British GDP also did not provoke any sharp price movements on the pair in the market, as they matched the expectations of the growth rate of 0.8% in the last reporting quarter and of 8.7% for the year.

On the US side, the biggest impact on the pair was made by the news on consumer spending cuts and an unexpectedly large increase in inflation.

Thus, the increase in consumer spending in May was 0.2% against 0.8% in April. Spending on services then increased by 0.7%, household spending on goods fell by 3.2%, energy prices increased by 35.8% and food prices by 11%. The growth of basic consumer prices in May also showed a decline of 0.2% over the month, amounting to 4.7%. Such situation, along with the Feds raising the key rate, creates the real preconditions for the economic recession. Analysts also forecast GDP decline in the next quarter.

Inflation in the U.S. is at its highest point in the past forty years, thus in May the annual inflation rate was 8.6%. According to the Fed Chairman Jerome Powell, the Reserve System specialists in this situation of increased unpredictability are beginning to realize that they understand the inflation mechanisms not so well as they would like to. The Fed hopes that inflation has now reached its maximum levels, but they do not exclude its further growth. In any case, we should not expect any easing of monetary policy in the near future.

Among the important macroeconomic news that might affect the price movement of GBP/USD pair in the nearest future we should mention the manufacturing activity index (PMI) for Great Britain and the manufacturing activity index (PMI) from ISM for the United States in June, which will be released later today.

Support and resistance levels

Alligator is hungry: his mouth is wide open, his jaw (blue line) hovers high above his lips and teeth (green and red lines), the instrument is in a downtrend. The nearest fractal below the alligators teeth (red line) is at 1,21260. Awesome Oscillator (AO) and Accelerator Oscillator (AC) are both in the red area, the bars are close to the zero level, which is a strong confirmatory sell signal.

✔️ Support levels: 1.21260, 1.20870, 1.20190.
✔️ Resistance levels: 1.21970, 1.22600, 1.23170.

Trading scenarios

✔️ Long positions should be opened at the 1.21970 with a target of 1.22600 and a stop loss at 1.21650. Implementation period: 1-2 days.
✔️ Short positions can be opened above the level of 1.21260 with a target of 1.20870 and a stop-loss at the level of 1.21650. Implementation period: 1-2 days.

1230818819_gbph4.jpg.72cbcbe83f93dae47ddc7f4823c9aaf6.jpg


More analytics on our website

Analytical department investizo

Disclaimer:
This material is provided as a general marketing communication for information purposes only and does not constitute an independent investment research. Nothing in this communication contains, or should be considered as containing, an investment advice or an investment recommendation or a solicitation for the purpose of buying or selling of any financial instrument.
 
General analysis NZDUSD for 04.07.2022

Current dynamics


The NZD/USD pair started the week positively. To continue the positive performance that ended last week’s trading session, after it fell to its lowest level in two years in the first half of Friday’s trading session.

The pair fell to its lowest level in two years as the risks of a recession intensified on Friday. A wave of risk aversion took clues from the downbeat US PMI, as well as fears of an economic recession. However, it appears that the cessation of optimistic bets on the Fed's next move may be the reason for the recent rebound in the pair in addition to the US holiday today.

Speaking of data, the US manufacturing PMI for June fell to its lowest level in two years, to 53.0 vs. 54.9 expected and 56.1 previously. Details indicate that the employment index fell to 47.3 from 49.6 and the new orders index fell to 49.2 from 55.1. Finally, the Price Paid Index dropped to 78.5 from 82.2, against market expectations of 81.0 It should be noted that the final readings of the S&P Global Manufacturing PMI for June fell to the lowest level since July 2020, to 52.7 versus the flash estimate of 52.4 and 57 in May.

After the data, ANZ Bank said data cleared from both the US ISM and PMIs indicated faltering demand growth, lower business backlogs, and lower production over the summer. It is difficult to escape growing pessimism about growth, which is also fueling expectations of a peak in both inflation and central bank hawks.

Given the significant events for the pair this week, the light schedule and the US holiday may constrain the pair ahead of the FOMC meeting minutes and US jobs report for June.

Support and resistance levels

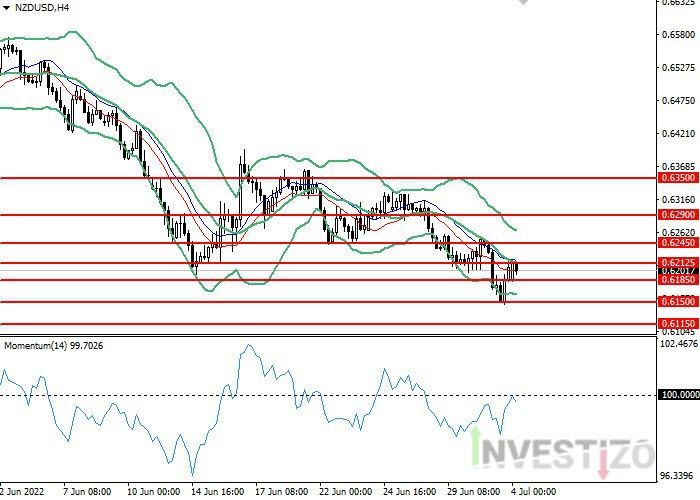
On the 4-hour chart, the tool is testing a consolidation above the Bollinger Bands moving average. The indicator is directed downward and the price range is narrowing, indicating that the current trend is about to change, and the momentum chart is below the 100 level, which gives buy signals. The Envelopes indicator gives sell signals.

✔️ Support levels: 0.61850, 0.61500, 0.61150.
✔️ Resistance levels: 0.62125, 0.62450, 0.62900, 0.63500.

Trading scenarios

✔️ Long positions should be opened at the 0.62125 with a target of 0.62450 and a stop loss at 0.61850. Implementation period: 1-2 days.
✔️ Short positions can be opened at the level of 0.61850 with a target of 0.61500 and a stop-loss at the level of 0.62125. Implementation period: 1-2 days.


1703556737_nzdh4.jpg.e445446ae8921028d298dde9bbd9c80d.jpg


More analytics on our website

Analytical department investizo

Disclaimer:
This material is provided as a general marketing communication for information purposes only and does not constitute an independent investment research. Nothing in this communication contains, or should be considered as containing, an investment advice or an investment recommendation or a solicitation for the purpose of buying or selling of any financial instrument.
 
General analysis USDCHF for 07.07.2022

Current dynamics


The USD/CHF pair opened today's trading session with a decline. The pair witnessed positive performance in the last five consecutive sessions. After the pair reached its lowest level since April in last week's session.

The dollar's recent gains came as a result of investors' demand for the dollar as a safe haven, after increasing indications of economic stagnation as a result of central banks' policies to contain inflation.

The minutes of the Federal Reserve meeting showed that the members of the Central Bank agreed on the need to continue raising interest rates in order to combat inflation and prevent it from continuing even in the event of a recession in the economy. US central bank officials acknowledged the possibility of raising interest rates to slow economic growth, but they stressed the need to contain inflation and reduce it towards the target by 2%.

Meanwhile, Kristalina Georgieva, Managing Director of the International Monetary Fund, said that the global economic outlook has become significantly bleak since the last economic update. And she added: A possible global recession in 2023 cannot be ruled out.

The US macroeconomic data showed, the US ISM Services PMI for June fell to 55.3 from 55.9 in May. However, the actual number came in better than market expectations of 54.5. ِAlso the US JOLTS Job Opening for May declined to 11.25 million versus 11.00 million expected and 11.68 million prior.

However, US 10-year Treasury yields rebounded from their lowest level in three weeks to 2.93%, but the higher reading of the two-year bond coupon, around 2.99%, in turn indicates global recession fears.

In view of today's events affecting the pair, on the American side, the he release of the Automatic Data Processing (ADP) Employment Change will remain in focus. as expectations indicate an improvement in the labor market to 200 thousand, which is higher than the previous reading of 230 thousand.Along with initial jobless claims are expected to remain steady at 230K, versus the previous release of 231K.

Support and resistance levels

On the 4 hour chart, the instrument failed to consolidate above the Bollinger Bands moving average. The indicator is directed upwards and the price range is widening, which indicates that the current trend is about to continue.The momentum chart is above the 100 level, which gives sell signals. The Envelopes indicator gives buy signals.

✔️ Support levels: 0.96850, 0.96250, 0.95600.
✔️ Resistance levels: 0.97575, 0.98375, 0.99100.

Trading scenarios

✔️ Long positions should be opened at the 0.96850 with a target of 0.97575 and a stop loss at 0.96250. Implementation period: 1-3 days.
✔️ Short positions can be opened at the level of 0.96250 with a target of 0.95600 and a stop-loss at the level of 0.96850. Implementation period: 1-3 days.
[IMG]


More analytics on our website
Analytical department investizo
Disclaimer:
This material is provided as a general marketing communication for information purposes only and does not constitute an independent investment research. Nothing in this communication contains, or should be considered as containing, an investment advice or an investment recommendation or a solicitation for the purpose of buying or selling of any financial instrument.
 
General analysis Brent for 08.07.2022

Current Dynamics


A U.S. presidential aide went to Saudi Arabia for preparations for a visit of Biden. Saudi Arabia began selling certain export oil grades with a discount in order to compete with Russian oil. Iraq increased its oil exports in June 2022. The Caspian Pipeline Consortium (CPC) operations were temporarily stopped for 30. China reported an increase in cases of COVID-19 which led to the return of restrictions on the movement of people in 11 cities.
White House Middle East Coordinator Brett McGurk went to Saudi Arabia to prepare a visit for U.S. President Joe Biden to the kingdom. It is worth noting that the themes of the visit will be preparations for a summit with the leaders of several countries in the Middle East, and also issues of entrainment of Saudi Arabia's oil production, and normalization of relations between Saudi Arabia and Israel.
Meanwhile, Saudi Arabia began to sell some export grades of oil with a discount in order to compete with the Russian oil. Those are Arab Heavy and Arab Medium grades, which are chemically closer to Urals, than the main Arab Light grade. However, Arab Light prices for August delivery, on the contrary, were increased. It is worth noting that Iran and Venezuela, which are under sanctions, will also dig their heavy oil grades with discount.
Iraq's Oil Ministry reported that Iraq exported in June 2022 oil of 101.191 million barrels or 3.373 million bpd, which is 2.21% more than the daily figures in May. So Iran's oil revenue for the month was $11.505 billion at an average price of $113.7 per barrel.
Meanwhile, the Caspian Pipeline Consortium (CPC) was temporarily stopped for 30 days. This pipeline connected Kazakh fields with Novorossiysk port, from where oil was shipped to tankers bound for Southern Europe and the United States. Last year, the CPC amounted to about 1.2mn bpd. About a third of this volume may be shipped via alternative routes, while the remaining 0.8 mln bpd may temporarily leave the market.
Meanwhile, China has reported an increase in COVID-19 cases, which led to the return of restrictions on the movement of people in 11 cities. In total, these regions together make up about 15% of the Celestial Empire's GDP.
Thus, a possible recession in the U.S. and Europe along with possible lockdowns in China put pressure on oil markets. However, the continuing shortage of heavy oil in the world, combined with the impossibility of quickly increasing oil production support markets. It should be recalled that oil sold from strategic oil sparsity will be delivered to customers until September, which also has some impact on the quotes.

U.S. Baker Hughes Total Rig Count and U.S. Baker Hughes Oil Rig Count will be released today at 19:00 (GMT+2).
Support and resistance levels.

The Brent price broke through the key Fibonacci level of 23.6 and fixed above. The RSI Oscillator has approached the 50 level in the lower zone.

✔️ Support levels: 102.25, 98.30
✔️ Resistance levels: 114.95, 111.00, 108.60, 106.65, 104.70

Trading scenarios

✔️ Long positions can be opened above the level of 104.70 with a target of 108.65 and a stop loss of 102.25. Implementation period: 2-4 days
✔️ Short positions can be opened below the level of 102.25 with a target of 98.30 and a stop loss of 104.70. Implementation period: 2-4 days

[IMG]


More analytics on our website
Analytical department investizo
Disclaimer:
This material is provided as a general marketing communication for information purposes only and does not constitute an independent investment research. Nothing in this communication contains, or should be considered as containing, an investment advice or an investment recommendation or a solicitation for the purpose of buying or selling of any financial instrument.
 
General analysis NZDUSD for 12.07.2022

Current dynamics


The NZD/USD pair is still under pressure at the beginning of today's trading session. Yesterday, the pair witnessed a negative performance, during which the pair recorded its lowest level in two years at 0.60957.

The NZD pair's recent weakness may be related to market fears of recession and a cautious mood ahead of Wednesday's monetary policy decision from the Reserve Bank of New Zealand.In addition to the market's conviction that the US central bank will maintain its tight policy to combat stubbornly high inflation. The bets were confirmed by the minutes of the Federal Open Market Committee meeting released last Wednesday, along with the strong US employment data, which was published on Friday.

The latest US macroeconomic data indicated that the US Non-Farm Payrolls rose by 372K for the month of June, vs. the 268K expected and revised lower by 384K previously.In addition, the unemployment rate matched market expectations at a level of 3.6%. The report notes that annual wage inflation, as measured by average hourly earnings, fell to 5.1% from 5.3% in May and labor force participation declined to 62.2% from 62.3.

On the other hand, Federal Reserve Board member Rafael Bostik supported a 75 basis point rate increase at the July meeting, where he stated that the latest inflation data is not as encouraging as he would have liked, and added that the information received in the past few months indicated a need to access To the neutral position more quickly.

As Karen Jane Beer, Biden's secretary to the press, stated that the upcoming inflation data will be very high.The monthly survey of consumer expectations released by the Federal Reserve in New York on Monday showed that consumers' expectations for one-year inflation increased to 6.8% in June from 6.6% in May. Three-year inflation expectations, however, fell to 3.6% from 3.9%.

Looking at the most important events affecting the pair, the focus is on the US consumer price index for June, which is scheduled for Wednesday. Earlier that day, the Reserve Bank of New Zealand will announce its monetary policy decision as it is expected to raise interest rates by 50 basis points to tame inflation.

Support and resistance levels

On the 4 hour chart, the instrument is consolidating at the bottom of the Bollinger Bands. The indicator is directed downwards with the widening of the price range, which indicates that the current trend is about to continue.The momentum chart is below the 100 level, which is giving buy signals. The Envelopes indicator gives clear sell signals.

✔️ Support levels: 0.61000, 0.60625, 0.60175.
✔️ Resistance levels: 0.61375, 0.61750, 0.62175.

Trading scenarios

✔️ Short positions should be opened at the 0.61000 with a target of 0.60625 and a stop loss at 0.61375. Implementation period: 1-2 days.
✔️ Long positions can be opened above the level of 0.61375 with a target of 0.61750 and a stop-loss at the level of 0.61000. Implementation period: 1-2 days.
[IMG]


More analytics on our website
Analytical department investizo
Disclaimer:
This material is provided as a general marketing communication for information purposes only and does not constitute an independent investment research. Nothing in this communication contains, or should be considered as containing, an investment advice or an investment recommendation or a solicitation for the purpose of buying or selling of any financial instrument.
 
General analysis USDCAD for 15.07.2022

Current dynamics


The USD/CAD pair opened today's trading session with a decline. To complete his strong reflection during his recent sessions.After rising from its weekly low to its highest level since November 2020 at 1,32235.

Looking at the reasons for the pair's volatility in recent sessions, the pair's decline came after the Bank of Canada raised the interest rate by 100 basis points to 2.5% in June, compared to market expectations for a rate increase of 75 basis points. The Bank of Canada statement said: With demand clearly increasing in the economy, inflation rising and widening, and more businesses and consumers expecting high inflation to continue for longer, the Board of Governors has decided to step up the path to higher interest rates.

However, the US macroeconomic data, which mainly indicates rising inflation to increase the chances that the Federal Reserve will implement a 100 basis point increase in July, came to be the main reason for the pair to reach its highest level in two years.

The US Bureau of Labor Statistics reported that the Producer Price Index (PPI) for final demand in the US rose to 11.3% on an annual basis in June from 10.9% in May, beating expectations of 10.7%. Additionally, there were 244,000 initial jobless claims in the week ending July 9 versus the previous week's reading of 235,000 and market expectations of 235,000. Weekly jobless claims were the highest in five months. The US Consumer Price Index (CPI) for June jumped higher 40-year level at 9.1% y/y vs. 8.8% expected and 8.6% previously.

On the other hand, some members of the Federal Reserve came in conflicting statements regarding the rate of interest rate hike in the upcoming meeting, as Federal Reserve member Rafael Bostic said this week that higher than expected inflation rates put the Fed funds rate increase by 100 basis points on the table. Another Fed member, Christopher Waller, said a 75 basis point hike at this meeting makes us neutral, adding that I think it makes sense that we have a stagnation in growth where it drops below the long-term average but doesn't turn negative.

Looking at the most important events affecting the pair today, attention will turn to the US retail sales, which is expected to rise 0.8% monthly in June from -0.3% recorded in May, and will precede the preliminary readings of the Michigan Consumer Confidence Index for the month of July, expected 49.9 vs. 50.0 previously.

Support and resistance levels

On the 4 hour chart, the instrument failed to consolidate at the upper side of the Bollinger Bands. The indicator is oriented sideways and the price range has shrunk, indicating that the current trend is about to change.The momentum chart is above the 100 level, which is giving sell signals. The Envelopes indicator gives clear buy signals.

✔️ Support levels: 1.30800, 1.30350, 1.29925.
✔️ Resistance levels: 1.31200, 1.31675, 1.32150.

Trading scenarios

✔️ Long positions should be opened at the 1.31200 with a target of 1.31675 and a stop loss at 1.30800. Implementation period: 1-3 days.
✔️ Short positions can be opened at the level of 1.30800 with a target of 1.30350 and a stop-loss at the level of 1.31200. Implementation period: 1-3 days.
[IMG]


More analytics on our website
Analytical department investizo
Disclaimer:
This material is provided as a general marketing communication for information purposes only and does not constitute an independent investment research. Nothing in this communication contains, or should be considered as containing, an investment advice or an investment recommendation or a solicitation for the purpose of buying or selling of any financial instrument.
 
General analysis XAUUSD for 19.07.2022

Current dynamics


The XAUUSD continues to trade actively and resumes its downtrend towards the strong psychological support at 1700.00.

Gold corrected on Monday at 1723.82, the highest level that this traditional safe haven asset reached, but by late afternoon the instrument returned to its downtrend. This price movement can be easily explained by the weakening of the U.S. dollar, caused by a decline in traders enthusiasm for the recently expected interest rate hike of 100 basis points at once. Whether it will actually happen, or the rate will be raised by the previously announced 75 basis points, we will know at the end of July during the next meeting of the members of the Federal Reserve, which will be held on the 27th.

The Australian National Bank claimed it expects the downtrend in gold to continue, should it break the support at $1675.00, it will continue southward at 1600.00. According to Laffer, a former adviser to President Reagan, the current situation with unprecedentedly high inflation in this century is caused by excessive monetary stimulation of the economy during the pandemic coronavirus and the only way to correct this imbalance is in the further tightening of monetary policy and reduction of the money supply, which will continue to lead to the strengthening of the dollar and lowering of the XAUUSD quotes.

At the same time, the analyst Hemke thinks that the FRS will be forced to switch over to the dovish policy as some experts believe that the economy is formally entering into recession, the citizens savings are fading, and the increase in consumer prices under an expensive dollar negatively affects the citizens attitude towards the representatives of the Democratic Party, which positions are hardly strong at the moment, which is an unacceptable luxury for the acting President on the threshold of the elections.

Traders interested in dealing this dynamic pair in the near future should pay attention to the following macroeconomic news: The number of construction permits issued tomorrow, Secondary housing market sales (June) and US crude oil inventories the day after tomorrow.

Support and resistance levels

Alligator is hungry: his mouth is wide open, his jaw (blue line) hovers high above his lips and teeth (green and red lines), the instrument is in a downtrend. The nearest fractal below the alligators teeth (red line) is at 1704.93. Awesome Oscillator (AO) and Accelerator Oscillator (AC) are both in the red area, the bars are close to the zero level, which is a strong confirmatory sell signal.

✔️ Support levels: 1700.40, 1693.30, 1683.60.
✔️ Resistance levels: 1722.00, 1716.00, 1710.70.

Trading scenarios

✔️ Long positions should be opened at the 1710.70 with a target of 1716.00 and a stop loss at 1705.00. Implementation period: 1-3 days.
✔️ Short positions can be opened at the level of 1700.40 with a target of 1693.30 and a stop-loss at the level of 1705.00. Implementation period: 1-3 days.
[IMG]


More analytics on our website
Analytical department investizo
Disclaimer:
This material is provided as a general marketing communication for information purposes only and does not constitute an independent investment research. Nothing in this communication contains, or should be considered as containing, an investment advice or an investment recommendation or a solicitation for the purpose of buying or selling of any financial instrument.
 
General analysis USDCHF for 20.07.2022

Current dynamics


The USD/CHF pair opened today's trading session with a decline. To continue the bearish performance of the pair for the third consecutive session. As the pair witnessed yesterday, Tuesday, a strong slide from the highest level in several weeks, touched last Thursday.

The US dollar continued its bearish path and extended its losses significantly during trading on Tuesday, with lower expectations of investors that the US Federal Reserve will tighten its monetary policy more strongly during its meeting next week, in light of the sharp decline in gasoline prices during the past month, a development that officials are likely to welcome. The Fed is concerned that expectations of high inflation may become ingrained and complicates their task of curbing price increases.

In addition to the statements of the Fed members that came to confirm that they are committed to raising the interest rate by 75 basis points in the current July meeting to reduce bets about the Federal Reserve escalating the pace of raising interest rates.

Whereas, Lewis Waller and James Bollader, Fed members said that they are leaning toward a 75 basis point rate increase at the next meeting, rather than a move by 100 basis points, to mitigate the negative effects on the economy.

As data published by the US Census Bureau on Tuesday, building permits came in at 1.685 million, above expectations (1.65 million) in June, and housing starts in the United States (MoM) came in at 1.559 million, below expectations (1.585 million) in June, the rate increased Building permits changed to -0.6% in June from the previous -7%. The initial housing change rate increased from -14.4% previously to -2% in June.

The main keys affecting the pair will be this week Initial Jobless Claims, and S&P Global Purchase Managers Index (PMI).

Support and resistance levels

On the 4 hour chart, the instrument is testing the consolidation at the bottom of the Bollinger Bands. The indicator is directed downward and the price range is widening, which indicates that the current trend is about to continue. The momentum chart is below the 100 level, which gives buy signals. The Envelopes indicator gives clear sell signals.

✔️ Support levels: 0.96800, 0.96425, 0.96050.
✔️ Resistance levels: 0.97150, 0.97825, 0.98350.

Trading scenarios

✔️ Short positions should be opened at the 0.96800 with a target of 0.96425 and a stop loss at 0.97150. Implementation period: 1-2 days.
✔️ Long positions can be opened above the level of 0.97150 with a target of 0.97825 and a stop-loss at the level of 0.96800. Implementation period: 1-2 days.

chf.jpg.760b93453887087e09025f0fb1454eb7.jpg


More analytics on our website

Analytical department investizo

Disclaimer:
This material is provided as a general marketing communication for information purposes only and does not constitute an independent investment research. Nothing in this communication contains, or should be considered as containing, an investment advice or an investment recommendation or a solicitation for the purpose of buying or selling of any financial instrument.
 
Top