Daily Market Analysis by CapitalStreetFX

GOLD STABLIZES, SHRUGGING OFF STRONGER GREENBACK


According to the official data released on Friday, in the first quarter of the year, China’s gross domestic product grew at the rate of 6.7 percent. Other indicators also reported with better-than-forecast readings. New loans, retail sales, industrial output and fixed asset investments all reported higher numbers. In the press conference held in Beijing, the National Bureau of Statistics announced that “downward pressure cannot be underestimated” despite positive changes in the economic indicators.

After positive Chinese economic data, perceived safe-haven assets went down due to improved risk sentiment towards the slowdown in the world’s second largest economy. Buying interest towards the Japanese Yen has also weakened due to comments from government officials on the yen’s recent appreciation.

The dollar gained on Friday, continuing its rise this week, while investors are waiting for the outcome of the G20 meeting in Washington for more information about future currency policies. The dollar index, which measures the strength of the greenback against a basket of major currencies, was up about 0.1 percent to 94.948.

Gold stayed stable today after falling consecutively for 3 days, but generally was still heading for a down week due to the stronger greenback and global equities, which make safe-haven metals less attractive.

gold.png

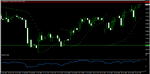
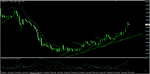
Fig. GOLD H4 Technical Chart

GOLD recovered slightly to as high as $1229.21. The commodity has been moving between the range of 1204.74 and 1285.56. RSI is now hovering around level 48 and seems to be heading up, indicating relatively strong buying power. Despite the pressure from the short-term moving average above, the price is expected to rise and retest the resistance at 1256.56 before dropping back.

Trading suggestion

Sell at $1285.56, Take profit at $1204.74, Stop loss at $1290.98.
 
The buck edges down as low level of the US consumer confidence

Last Friday, a Federal Reserve report showed that the US manufacturing output for March dropped the most in over a year as falling down 0.3% in factories. Meanwhile, the economists’ forecast called for a 0.1% increase. The total industrial production, which includes utilities and mines, was lower 0.6% compared with estimation for a second month.

The Federal Reserve Bank of New York also released the Empire state manufacturing index. The data showed that the business activity in New York is boosting as the record level of 9.6 in more than a year of the headline general business conditions. The market outlook in next six months is improving continuously as rising for the third consecutive month.

The University of Michigan on April 15 announced that the consumer confidence for this month dropped from the previous level of 91.0 to 89.7, the lowest level since last September.

The Fed official Dudley commented today that the central bank still keeps caution in increasing interest rates due to the drawbacks from economic growth. The greenback is under downward pressure as the dollar index DXY slid to 94.43, down 0.29% from the last close.

The Statistics New Zealand on Sunday released that the consumers price index (CPI) advanced 0.2% in the 2016’s first quarter on three-month basic. The core CPI, which excludes cigarettes and tobacco, marked a decline of 0.1%. The annual CPI inflation rose 0.4% last quarter, indicating that the nation’s economy is on way up.
nzdusd-h11-1024x500.png

Fig. NZDUSD H1 Technical Chart

The kiwi is surging up, leading the pair NZDUSD to the bullish market. The parabolic SAR band is lying under the price chart, giving the price support to climb more. RSI (14) is registering at 63.2322, indicating that the upside trend may continue. From the support of 0.68421, the price is expected to test the resistance of 0.69597.

Trading suggestion

Buy at 0.69538, Stop loss at 0.69520, Take profit at 0.69594
 

Attachments

  • nzdusd h1.png
    nzdusd h1.png
    21.3 KB · Views: 152
Euro Climbs As Investor High On Cofidence

European central bank (ECB) today reported that the EU’s current account balance today. The current account was reported with a surplus of €19 billion for the month of February. This compares to a surplus of €25.4 billion for January. The February’s accrued current account surplus forms about 3.1% of the EU gross domestic product (GDP), in comparison with the reading of 2.7% of February 2015.

According to data from this report, combined direct and portfolio investment witnessed a €112 billion rise in assets and a €9 billion decline in liabilities in February. The central bank also announced that: “In the 12 months to February 2016 combined direct and portfolio investment recorded cumulated increases of €829 billion in assets and €262 billion in liabilities, compared with increases of €878 billion and €623 billion respectively in the 12 months to February 2015.”

The ZEW financial market survey today reported that the sentiment index for Germany’s economy this month edged up sharply to 11.2. In general, the index for the euro area rose to 21.5, compared with the prior level of 10.6. Investors are currently holding very optimistic views on recovery in the EU.

In the US, the NAHB Housing Market Index remained unchanged for three consecutive months with the reading of 58. This showed the builders’ strong belief in the housing market. Meanwhile, statements from Fed official Dudley yesterday pointed that the rate hikes may not be carried out before June due to slowdown risks in the economy. Caution still seems to be preferred by the central bank.
eurusd-h1-1024x498.png

Fig. EURUSD H1 Technical Chart
DI+ is at 23.5601, far higher than the reading 9.6903 of DI-. Therefore, a buying position is suggested. Meanwhile, the ADX indicator is heading up and registers at 36.1002, implying that the current uptrend may continue. The Parabolic band lies under the price chart, giving the pair support to climb up and the next resistance to test is 1.13612.
Trade suggestion
Buy at 1.13304, Stop loss at 1.13250, Take profit at 1.13605.
 

Attachments

  • eurusd h1.png
    eurusd h1.png
    23.9 KB · Views: 152
Greenback Plunges Due To Weak Economic Data


Early this week, the National Association of Home Builders reported that the housing market index for April stayed unchanged for the third straight month, at the reading of 58. The index indicates that builders still hold an optimistic stance on construction growth. NAHB Chairman Brady commented that the housing sector is now recovering consistently even though its at a slow pace. However, the Commerce Department yesterday announced that housing starts and building permits last month dropped to a level of 1.09 million, which is lower than forecast. The readings for February and January were at 1.19 million and 1.18 million, respectively. The Fed’s dovish standpoint on rate hikes, still keeps weighting on the greenback. The dollar index DXY today witnessed a fall to 94.03, down about 0.1% from the previous close of 94.12. In a speech on Tuesday, Bank of Canada Governor Poloz restated that the economy is still under pressure from the significant decline in oil and other commodities’ prices. The country needs more momentum to recover its economic growth and reach the target 2% in inflation. US Crude Oil stockpile data is to be released today. It climbed by 6.6 million barrels in the week ended at April 8. It is expected to mark a slight increase of 2.2 million barrels for the last week. However, investors have their doubts about the forecast as the inventories’ real level has never registered as expected.

usdcad-h1.png


Fig. USDCAD H1 Technical Chart ADX (14) has lowered to the level of 26.1767, indicating that the downtrend is weakening. The dollar is striving to strengthen against the loonie. However, the bear is coming back as the SMA 7 (green line) crossed SMA 14 (red line) and is lying below it. The pair is expected to break the 0 level of the Fibonacci retracement.

Trade suggestion

Sell at 1.26320, Stop loss at 1.26420, Take profit at 1.26130.
 
Euro Stays Firms Ahead Of ECB Meeting


Today, the UK Office for National Statistics released retail sales data, reporting a 1.3% fall in March from the month before. The retail sales year on year marked a slight decline of 0.1% last month. Accounting for 13.2% of the amount spent in the retail industry (excluding automotive fuel),online sales in March, were a little from the February’s reading, but up 8.9%, compared with the same period in the last year.

The organization also announced that the public sector net borrowing (excluding public sector) for the financial year ended in March 2016 registered at £74.0 billion, compared with the reading £91.7 billion for the preceding financial year. The central government net cash requirement also tumbled £26.4 billion to £58.2 billion on a year on year basis.

The UK Labor market is facing some pullback, as shown by data reported on April 20. While unemployment last month stayed unchanged at 5.1%, the claimant count showed that there were 732,100 people claiming unemployment related benefits, increasing from a number of 725,400 people in February.

In the euro area, Germany’s producer price index (PPI) for March slid 3.1% on a year on year basis. The core PPI, which excluded energy was down just 0.9% on a YoY basis, as energy prices witnessed a sharp drop of 9.2%.

The Market is now focusing on the ECB’s policy meeting later today with a strong expectation that the European central bank will keep the interest rate unchanged. The UK FTSE 100 is pairing its gains, down about 0.7% from its highest closing price this year. Meanwhile the German DAX 30 and the France CAC 40 indices are showing little change.
erugbp h1

erugbp-h11.png

Fig EURGBP H1 Technical Chart

The two moving averages are moving together and tending to move above the price chart, casting a shadow on the pair. The bear seems still dominant as RSI (14) is at 44.7938 and heads down. ADX (14) stands at 11.0151, indicating that the current downtrend is weakening. A reversal into an uptrend is expected. The euro is anticipated to strengthen against the sterling.

Trade suggestion

Buy at 0.78926, Stop loss at 0.78790, Take Profit at 0.79235.
 
Yen Plunges As Threat Of Deflation Looms

The Flash Manufacturing Output Index for Japan was released yesterday, with a reading of 47.9 for April, lower from 49.8 in March. The Nikkei Flash Manufacturing Purchasing Managers’ Index (PMI) this month also witnessed a fall of 1.1 points to 48.0. The index currently shows the fastest pace of decline in the last three years. In the recent two months the flash Manufacturing PMI has turned downwards, staying under the average. This reflects a slowdown in the manufacturing sector.
The Ministry of economy, trade and industry (METI) today reported that Japan’s tertiary industry activity index (seasonally adjusted), inched down 0.1% in February, smaller than the forecast of a 0.4% drop. The decrease came on the back of a fall in activity in the information services, electricity, gas, heat supply and water sectors in February was dominant the rises in information and communications, wholesale trade, finance and insurance. On a year basic, the index edged up 2.3%.
The Bank of Japan (BOJ) is scheduled to hold a two-day meeting on April 27/28 and economists predict that the central bank will continue easing of the monetary policy. Interest rates may be lowered further from the already negative levels. In Friday’s trading, Japan’s benchmark Nikkei index ended the day at 17,572.49, an 11-1/2 week high.
Canada’s consumer price index m/m is to be released a little later. It is expected to increase 0.3%, higher than the 0.2% increase in the preceding month. The Canadian dollar is on its way to strengthening further, as oil prices’ continue rising.

tarf5c.png


Fig. CADJPY H1 Technical Chart
CADJPY is on track to rise on a weakening yen. The price has been moving sideways around the level 23.6 of Fibonacci retracement for some time, and started climbing up, to break through the level 0. The trend indicator shows that the market is moving towards a clear uptrend as the green arrow appeared under the price chart. DI+ now is higher than DI-, also suggesting a buy position. The pair is expected to surge higher.
Trade suggestion
Buy at 87.225, Stop loss at 87.021, Take profit at 87.584.
 
Greenback Slides Ahead of FED Meeting

The US Flash Manufacturing PMI for April was released on friday, with the reading of 50.8, the lowest level since 2009. The current level reflected the weakest overall business conditions for over six-and-a-half years.
According to a report the Commerce Department published today, new home sales in the US fell for three straight months, down 1.5% on a yearly basis, standing at 510,000, lower than the expected gain of 520,000 for the period.
Tomorrow, The FED is scheduled to begin a two-day meeting on monetary policy. Most officials seem to be maintaining a dovish stance. Economists suppose that the rate hikes may not be possible until the next meeting in June 2016 at the earliest. The central bank is thus expected to keep the interest rate at 0.25%. In response to this expectation, the greenback is turning lower. The dollar index opened this week with a small gap and is now trading at 94.80, down 0.25% from the last close.
On Monday, data from euro zone indicated that the EU economy in on track to recover. The Belgian Business Climate data reported today showed that the production capacity utilisation rate (seasonally adjusted) was at 79.4% in April, compared with the reading of 79.5% in January.

EURUSD H1
2rc2xza.png

Fig. EURUSD H1 Technical Chart

After testing the support of 1.12147, EURUSD is striving up and just broke the 23.6% level of the Fibonacci retracement. The Stochastics chart shows that the price is struggling and preparing to escape from overbought territory. The euro is expected to rise against the greenback, leading the pair to hit the 38.2% level of Fibonacci retracement, and may then pull back.

Trade suggestion

Buy at 1.12715, Stop loss at 1.22645, Take profit at 1.12815
 
Pound Dims Further As Industries Facing Slowdown

Early this week, the UK CBI released its Industrial Trends Survey for the first quarter in 2016. The report showed that total new orders continued its 4% decline in the preceding quarter due to a fall to -7% from the previous reading of -2% in export’s balance. Meanwhile, the average unit increased 8%, the two-year fastest pace, nearly meeting the long run average (10%).

According to data released today, March’s mortgage approvals in the UK year on year were up 20%, including a rise of 25% and 14% in remortgaging and house purchases, respectively. The gross mortgage borrowing created reached its highest level since April 2008, registering at £17.1 billion last month, surging up 64% compared with the same period a year ago.

In the US, The Commerce Department on Monday reported that total home sales fell for the third consecutive month, marking a 1.5% drop to an annualized pace of 511,000. The real-estate sector in the US is now witnessing its slowest growth since July 2014.

Today, the Federal Reserve Bank started its two-day monetary policy meeting. Markets hold no expectations of a rate hike at this April meeting as some FED’s officials have already expressed their dovish stance on rates, due to weak data on economic growth. Ahead of the central bank’s decision, the dollar index DXY is down 0.21% from its previous close, at 94.6.


gbpusd-h1-768x376.png

Fig. GBPUSD H1 Technical Chart

The Stochastics chart shows that the pair is striving to get out of overbought territory after testing the resistance of 1.46369. The sterling is anticipated to continue tumbling against the greenback. The 23.6% Fibonacci retracement level is expected to be reached and become the next support of the price chart.

Trade suggestion


Sell at 1.45688, Stop loss at 1.45814, Take profit at 1.45585.
 
Aussie Stumbles, As Risk Of Rate Cut Looms

Late yesterday, Australian Bureau of Statistics reported that the consumer price index (CPI) for the first quarter in 2016 edged 0.2% lower, after a rise of 0.4% in the previous quarter. On a yearly basis, the annual inflation rate marked a record low at 1.3% – the lowest since 2008, including increases of 0.6% and 1.7% in tradeable goods and non-tradable goods, respectively.

Facing the weakest annual consumer-price gain in the last eight years, the country’s inflation is anticipated to not meet the target of 2% for a continued period. The Reserve Bank of Australia is expected to lower its interest rates at its meeting next week.

Statistics New Zealand reported on April 26 that due to declines in primary produce exports in March, the annual trade balance deficit registered at $3.8 billion, the largest reading in seven years. The value of imports (seasonally adjusted) fell to $12.8 billion, 3.2% lower than imports for the previous quarter, while the value of exports slid 1.2% to $11.9 billion.

Today, the Reserve Bank of New Zealand is scheduled to announce the official cash rate with an expectation for the rate to remain unchanged at 2.25%.

audnzd-d1-768x378.png

Fig. AUDNZD D1 Technical Chart

RSI (14) is pointing down and has fallen to 46.7183, indicating an upcoming bearish market. The parabolic SAR band was reversed by a bearish candle, and has begun to appear above the price chart, thus confirming the downtrend. The Aussie is expected to keep tumbling against the Kiwi, leading the pair to test the support at 1.09640.

Trade suggestion

Sell at 1.10675, Stop loss at 1.10823, Take profit at 1.10434
 
Yen Rockets After BOJ Meeting

After a two-day meeting on monetary policy, Bank of Japan suddenly announced that there is no additional stimulus planned for the economy at this time, and the deposit rate was left unchanged at -0.1% as in January. A few days ago, the central bank was widely believed to deploy additional monetary easing, facing slowdown in growth and the possibility of deflation.

Yesterday, data on Japanese industrial production for March was released. It came in with a reading beating expectations. Output last month surged up 3.6% compared with a fall of 5.2% in February. On a year basis, the index was up 0.1%, indicating that the economy is on its way to a recovery, although at a slow pace.

According to data published earlier today, Japanese consumer price index dropped 0.1%, while economists’ had forecast it to remain unchanged. The core CPI (excluding fresh food) in March fell 0.3% on a yearly basis. After eliminating the effect of energy prices, the index marked a 1.1% increase from a year earlier.

The US GDP (q/q) for the first quarter in 2016 was released today with the reading of 0.7%, higher than the expectation of a 0.5% increase. The index for the quarter prior was at 0.9%. The dollar is extending its downward move after The FED’s announcement that the interest rates remain unchanged, and no clear signals for rate hike were provided. The dollar index DXY dimmed to 93.83, down 0.6% from the last settlement.


usdjpy-d1-768x380.png

Fig. USDJPY D1 Technical Chart

USDJPY is in a continuous fall due to a strong yen after hitting the resistance of 123.797 in November 2015. The pair is in a bear market as indicated by the reading 37.3666 on the RSI. The current downtrend is expected to continue. A selling position is encouraged as signaled by the red arrow.

Trade suggestion


Sell at 108.420, Stop loss at 108.614, Take profit at 108.060
 
Dollar Expands Losses Ahead Of PMI data

The Federal Statistical Office, Switzerland, reported today that total retail sales extended its downbeat trend since January 2015, with a sharp decline of 2.4% in March compared with a year earlier. On the same basis, after adjusting for special sales and holidays, real revenue from the retail sector witnessed a drop of 1.3% in March 2016. Retail sales of food, drinks and tobacco, which rose 1.6% in real terms, could not offset the big fall of 3.8% in the non-food sector.

In other data released today, the manufacturing PMI in Switzerland, which was at 53.2 in March, edged up to 54.7 last month. The reading marked a record high in the last two years, indicating that the country’s economy is growing.

The Commerce Department in US announced on Friday, that core personal consumption expenditure (PCE) price index (excluding food and energy) inched up 0.1% in March, in comparison with a rise of 0.2 percent in the preceding month. Due to the weak recovery in the economy, the Federal Reserve does not seem likely to raise interest rates twice this year. The greenback has continued to tumble today, with the dollar index DXY testing the level of 92.71, only 9 points above than its one year lows.

The Market is focusing on the US ISM Manufacturing PMI for April – scheduled to be released a little later today. Economists’ forecast a reading of 51.6, which is lower than the previous reading. This Monday, Swiss National Bank Chairman Jordan is scheduled to speak about the Euro and Swiss monetary policy.
usdchf-d1-1024x518.png

Fig. USDCHF D1 Technical Chart

The USD is on track to weaken against the swissie, leading the pair USDCHF towards approaching the oversold territory as indicated on the stochastics chart. The price is expected to recover soon, trimming the recent losses. A buying position is suggested as the green SAR arrow has appeared under the price chart.

Trade suggestion

Buy at 0.96297, Stop loss at 0.96128, Take profit at 0.96549
 
CAD Rattles GBP As UK PMI Crashes to 3 Year Low

Markit Economics reported earlier today that UK manufacturing PMI, which was at 50.7 in March, tumbled hard to a seasonally adjusted level of 49.2 in April. This is the lowest level in the last 3 years, indicating headwinds in UK economic growth.

The FTSE 100 is extending its downtrend, edged down to a three-week low of

6177.70, 1.5% lower than the last close.

The Royal Bank of Canada yesterday reported that Canadian factory PMI for April was up slightly to 52.2 from 51.5 in March, thanks to a rebound in output, new business and employment growth. The latest reading indicates a moderate expansion in Canada’s business conditions.

Market is awaiting comments on monetary policy by BOC Governor Poloz, later today. Also on the cards tomorrow, is the Canadian trade balance for March. It is forecast to come in at a 1.2 billion deficit. The shortfall in February was at 1.9 billion.

In trading on Tuesday, oil prices have pared the recent gains, dropping back due to lingering concerns on output from the Middle East. The global benchmark Brent is down to $45.33 per barrel, 1.4% lower than the last settlement. The price may continue to fluctuate further, as US crude oil inventories for the last week of April will be reported on Wednesday.

gbpcad-d1-1024x501.png

Fig. GBPCAD D1 Technical Chart

The sterling is on way to keep strengthening against the Loonie for several days, after the pair GBPCAD hit the support of 1.80859 on April 21. The trend signals indicator has been suggesting a selling position for 71 D1 candles with the profit of 18734 from the beginning of the downtrend. The price is supposed to enter the bullish market after some consolidations.

Trade suggestion

Buy at 1.85100, Stop loss at 1.84357, Take profit at 1.86875
 
Gold Falls As Dollar Rises Ahead of ADP Non-Farm Jobs Report

The US Institute for Supply Management reported earlier that the ISM Factory PMI for April slid to 50.8, and did not meet the forecast of a 51.6 reading. The manufacturing sector has expanded for the second month, but at a slower pace than in March due to weak global demand.

According to Autodata Corp., April’s total vehicle sales (seasonally adjusted) in the US registered at an annual rate of 17.42 vehicles, 3.6% higher than the reading in the same period last year. The data indicates that American demand for trucks and sport utility vehicles is still strong.

The US dollar is rising ahead of ADP’s report on non-farm employment change, with a forecast of 205,000 jobs added in March. Measuring the strength of the greenback against six peers, the dollar index DXY is now paring its recent losses. The index today bounced back to 93.21 after creating a record low of 91.92. The rally of the global currency is putting a downward pressure on the gold prices.

World stocks on Wednesday are in red territory, continuing the trend so far this week as investors are afraid of a prolonged global growth downturn, which is implied in the weak PMI data seen recently. Nasdaq futures today tumbled to 4308.82, down 0.7% from the previous close. The UK FTSE has also witnessed a fall of 1.3% to 6105.80 from the last settlement.

In response to the negative signals from stock market, investors tend to rush into other safe-haven assets, namely gold, Japanese yen, etc. The demand for this precious is about to increase.

gold-d1-1024x506.png

Fig. GOLD D1 Technical Chart

GOLD retreated after testing the resistance of 1303.89 on Monday. ADX (14) is pointing down, indicating that the current trend is getting weaker. However, the green arrow below the price chart still suggests a buying position. The commodity is expected to continue falling in the short-term and reverse into an uptrend later.

Trade suggestion

Sell at 1272.49, Stop loss at 1275.33, Take profit at 1268.11
 
Strong Retail Sales and Falling Trade Deficit Boost AUD

Late yesterday, The Australian Bureau of Statistics (ABS) reported that retail sales in March rose in most sectors, especially in footwear and personal accessories (0.7%) and household goods (0.2%). This boosted March’s total turnover (seasonally adjusted) to a rise of 0.4%, higher than the 0.3% increase expected by economists. On a yearly basis, retail sales edged up 3.6%.

Also published by ABS on Wednesday was the trade deficit for March. The deficit has been narrowing, coming in at A$2,16 billion in March, the lowest level since June 2015. The value of imports was up 1% from the reading in February to A$28.7 billion in March. Meanwhile, exports witnessed an increase of 4% to A$3.04 for the same period. All readings are in seasonally adjusted terms.

In the US, non-manufacturing sector extended its growth for 75 straight months as indicated by the latest ISM Non-manufacturing PMI. The index jumped to 55.7 last month, 1.2% higher than the reading of 54.5 in the preceding month, reflecting a slightly faster pace of growth in the non-manufacturing sector of the economy.

ADP non-farm employment change was also released yesterday, reporting 156,000 jobs created in April. This reading did not meet economists’ forecast of 205,000 jobs created in April.

In response to mixed data, the dollar index DXY moved in uncertain fashion for a while and then climbed up to 93.62, about 0.4% higher than the last close.

Currently, the market is focusing on the Department of Labor report on Unemployment claims with a forecast of 216,000 people filing for unemployment benefits during the past week. Also being watched is a scheduled speech by FED member Bullard, for hints on future U.S monetary policy.


audusd-d1-1024x501.png

Fig. AUDUSD D1 Technical Chart

Due to the weight of the RBA’s decision to cut interest rates two days ago, the Aussie has tumbled, leading AUDUSD to enter the oversold territory. The level 38.2% of Fibonacci retracement was hit and is likely to become a support for prices. A reversal into an uptrend is expected to happen in the near future. The green SAR arrow under the price chart still suggests a buying position.

Trade suggestion

Buy at 0.74978, Stop loss at 0.74361, Take profit at 0.75628
 
Buck Uncertain Ahead of NFP Report

Data released earlier by Statistics Canada reported that the total value of building permits, which gained 15.3% in February, edged down 7.0% to $6.9 billion in March. March’s residential permits increased for the second consecutive month to the value of $4.4 billion, up 4.8% from February. However, in the non-residential sector, the reading extended its recent decline, registered at $2.4 billion in March, 22.8% lower than the reading in the previous month. Negative data from the real estate market reflects that Canada’s economy is in a slowdown, and any clear signals of a recovery are not yet visible.

In the last several days, a forest fire has broken out in Canada, near the heart of the country’s oil sands region. The raging wildfire caused some setbacks to oil production and is anticipated to stall Canada’s economic growth in the second quarter of 2016. Dependent heavily on the energy market, especially on oil prices, the Canadian Dollar is facing strong downward pressure, as various factors combine to weigh it down.

Later today Canadian labor market data is on the calendar, with muted expectations by the market. The jobs creation number, which was at 40,600 in March, is forecast to post at just 200 positions added last month. The unemployment rate may inch up a little to 7.2%, compared with 7.1% in the previous month.

Meanwhile, the US labor market is also growing at a slower pace than earlier, as indicated by recent data. The number of people claiming for unemployment benefits increased unexpectedly last month, coming in at 274,000. In the month before, jobless claims were at 257,000.

Markets are currently turning all their attention towards the Non-Farm Payrolls report out later today, with an estimate for 203,000 new jobs created during the previous month, 5.6% lower than the March reading of 215,000. An actual reading lower than forecast will contribute towards indications of a slowdown in the world’s largest economy. This may pressurize the greenback lower against its peers.

The dollar index DXY has been witnessing stable movement today, standing at 93.62, down 1.5% from the last close.

24go9yd.png


Fig. USDCAD D1 Technical Chart

Hitting the support of 1.2574 on May 03, the pair USDCAD has rocketed into the overbought territory as shown on the Stochastics chart. However, the %K line (blue line) has already reversed, preparing to cross the %D line (red line). The bull’s power is about to die down, and the price is expected to pull back after testing the level 23.6% of Fibonacci retracement as a resistance.

Trade suggestion

Sell at 1.27833, Stop loss at 1.28657, Take profit at 1.26808
 
Dollar Climbs On Hopes Of Multiple US Rate Hikes

The Markit Institute reported on Friday that, retail sales in the euro area dropped sharply at the start of the second quarter. The retail PMI in April edged down to 47.9 from a reading of 49.2 in the previous month. This is the steepest fall in sales in over a year.

Compared with the same period last year, turnover in the retail sector also witnessed a decline last month, instead of following the expected growth curve on an annual basis in March.

Data released today showed a better-than-expected reading for the sentix investor confidence index for the Eurozone. The index reading for May registered at 6.2 points, a little higher than economists’ forecast of 6.1. Last month, the index was at 5.7 points.

Today, the President of Eurogroup meets with finance ministers from euro area member states and the ECB President. The meeting is held with the purpose of discussing a range of financial issues. Hence, investors are eyeing statements and clues from the meeting for decoding future policy moves. At today’s meeting, ECB’s Vítor Constâncio commented that the central bank was still able to guide inflation back to near the target of 2% this year and their stimulus measures deployed in March need time to come into effect.

In the US, the non-farm data was released on Friday with 106,000 added jobs in April, the lowest level in seven months. The expectation in the market was for a reading of 203,000 new jobs. After the report, the US dollar dropped significantly and marked a record low in over a year. However, the currency quickly trimmed the losses due to encouraging annual wage growth, and comments from Fed member Dudley that two rate hikes this year is a reasonable expectation.

Today, the dollar index DXY extended its current uptrend and advanced to 94.10, 0.2% higher the previous close. This reflects that the greenback is getting stronger against its peers.


eurusd-d1-1024x496.png


Fig. EURUSD D1 Technical Chart

ADX (14) has lowered to 28.9051, indicating that the current uptrend is getting feeble. After hitting the resistance of 1.16119 on May 03, the Euro is on track to weaken against the USD. However, the trend signal indicator still encourages a buying position, and the price is expected to hit the level 38.2% of Fibonacci retracement and then may bounce back, continuing its up move.

Trade suggestion

Buy at 1.14089, Stop loss at 1.13625, Take profit at 1.14875.
 
Pound Firms Up As Trade Balance Strong

Data from the Office for National Statistics showed that the UK trade deficit for March reduced to £3.8 billion from the reading of £4.3 in February. In particular, the goods trade balance registered a shortfall of £11.2 billion in March, meeting economists’ forecast, narrowing from £11.4 billion in the preceding month. Meanwhile, the surplus for the services sector extended from £7.1 billion in February to £7.4 billion in March. The latest data hinted at a slight recovery in UK’s economy.

On Monday, the British Retail Consortium (BRC) had reported that the annual rate of retail sales last month witnessed the biggest decline since last August. In April, the BRC retail sales index fell 0.9% from a year earlier, burdened with a very low turnover in the clothing and footwear sector due to prolonged cold weather. The index decreased 0.7% in the previous month.

A month ahead of the Brexit vote, the BOE Governor commented that the central bank was adopting a wait-and-watch approach for future monetary policy. The UK’s official benchmark rate is to be discussed by the BOE at its scheduled Thursday meeting.

Yesterday, the Federal Reserve announced that conditions in the US labor market were brighter last month as the labor market condition index inched down by only 0.9%, on monthly basis in April, compared with a fall of 2.1% in March. Wholesale inventories data for March is scheduled for today in the US. It is expected to increase 0.2% after sliding 0.5% in the month before. The dollar index DXY today is flying high, standing at 94.23, up 0.07% from the last close.

gu-d1-1024x495.png

Fig. GBPUSD D1 Technical Chart

The stochastics chart shows that the pair GBPUSD dropped significantly into oversold territory after hitting the resistance of 1.47696 a week ago. Today, sterling is on its way to strengthening against the USD, climbing up from the support of 1.43710. The %K line (blue line) has already crossed the %D line (red line). A reversal into uptrend is likely to be confirmed. The signal trend indicator suggests a buying position as the green arrow has formed below the price chart.

Trade suggestion

Buy at 1.44522, Stop loss at 1.43904, Take profit at 1.45277
 
USD Gingerly Ahead Of Federal Budget Balance Report

Ahead of the RBNZ’s financial stability report on May 10, investors had priced in the possibility New Zealand’s central bank would release new measures on lending to the property market due to recent excesses in Auckland’s housing market. However, the central bank did not make any changes to the current lending rules yesterday.

It is likely that a lower interest rate was not enough to prevent the slowdown led by risks from low dairy prices and surging houses prices in the last six months. Hence, Governor Wheeler commented that restrictions were currently analyzed and calculated and the time frame to issue new measures has not been defined yet.

Tomorrow, retail sales (q/q) are scheduled to be released by New Zealand Statistics, with a forecast for a 1.0% increase for the first quarter in 2016. In the same period last year, the retail sales witnessed a jump of 2.7%.

In the US, wholesale inventories for March inched up 0.1% from the previous month. Economists had forecast a rise of 0.2% in wholesalers’ stockpiles. Data from the Commerce Department also showed that revenue in this sector marked the fastest pace of growth since last April, climbing 0.7% in March.

US Federal budget balance is scheduled to be released tomorrow. The reading is expected to register a surplus of $116.2 billion in April, compared with a deficit of $108.0 billion in the month before. The dollar index DXY is moving gingerly, standing at 94.15, 12 points lower from the last close.

nzdusd-d1-1024x500.png

Fig. NZDUSD D1 Technical Chart

Yesterday, NZDUSD made a sharp mover lower to hit the level of 0.67139 – the lowest since March 29, due to bearish sentiment engulfing the kiwi. The pair plunged into the oversold territory and may recover from this zone as the %K line (blue line) has already crossed over the %D line (red line). The price is anticipated to maintain the up trend. Level 50.0% of Fibonacci retracement is still on hold. A buying position is encouraged by the trend indicator.

Trade suggestion

Buy at 0.68015, Stop loss at 0.67653, Take profit at 0.68371
 
All Eyes On BOE Meeting, Sterling Stuck In Range

The Office for National Statistics yesterday announced that UK industrial production rose 0.3% in March compared to the previous month. This did not meet economists’ expectations for a 0.7% increase. On yearly basis, the industrial production for March inched down 0.2%. The manufacturing sector witnessed a slump of 1.9% in March output, compared with the same period last year. The sharp decline in this sector was the main contributor to the decrease in total industrial production.

Data from the National Institute of Economic and Social Research (NIESR) indicated that NIESR’s estimate for the British GDP was for a growth of 0.3% in the three months ending in April 2016 after an increase of 0.4% in the three months ending in March 2016. This indicates that the nation’s economy is showing a slower pace of growth.

Today, the Bank of England (BOE) will hold a meeting on monetary policy with the markets holding high expectations from it. All eyes are focusing on some clues of “Brexit” before an official referendum in June. In addition, the UK benchmark rate is forecast to remain unchanged at 0.5%.

In the US, Department of the Treasury reported that the Federal budget surplus came in at $106.5 billion for March, lower than the expectation of $116.2 billion. In the preceding month, the US budget marked a deficit of -$108.0 billion.

The initial jobless claims for the week ending on May 06 are scheduled to be released today, the number of people filing for unemployment benefits is forecast to come in at 277,000, compared with 274,000 people in the week before.

In Thursday’s trading session, the dollar index DXY is fluctuating in a narrow range,and is currently at 93.95, 12 points higher than the last close.

gbpusd-1024x494.png


Fig. GBPUSD D1 Technical Chart

Falling from the resistance of 1.47675 formed May 03, GBPUSD has been moving sideways inside a narrow range, ahead of the BOE meeting. The level 38.2% of Fibonacci retracement may become a solid support for the price, as the pair failed to close far below this level. The price is supposed to start rising soon, as the green arrow under the price chart still suggests a long position.

Trade suggestion

Buy at 1.44753, Stop loss at 1.43852, Take profit at 1.45558
 
Greenback Stays Firm As Data and FED Hints At Recovery

Data from Eurostat today showed that gross domestic product (GDP) expanded in most Eurozone countries, except for contractions of 0.4% and 0.1% in Greece and Latvia, respectively. In Germany, GDP grew 0.7%. Meanwhile, France saw an increase of 0.5% in GDP growth. For the whole euro area, GDP was up 0.5% in the first quarter of 2016. The latest reading is a little lower than a 0.6% increase as expected by economists. The common currency seems to be firming up as positive data on economic growth shows up.

According to data released on May 12, after eliminating seasonal effects, the number of people in U.S filing for unemployment insurance surged up to 294,000 in the week ending on May 06. This is a 15-month peak, being the highest number since February 2015. Economists had expected a reading of 277,000 jobless claims in the last week, a little higher than the 274,000 claims in the previous week. After the report, the USD stumbled sharply against its peers and then trimmed its losses promptly thanks to data on foreign trade.

According to a report from the US Bureau of Labor Statistics yesterday,import prices for April rose 0.3% following a similar rise in the preceding month. The rise was driven by a recent rally in fuel prices. The price rises in the last two months were at the fastest pace since last May. In comparison with a year earlier, the price index for US imports edged down 5.7%.

Meanwhile prices in the export sector posed the first monthly advance in over a year by climbing up 0.5% last month. On yearly basis, the index declined 5.0%. However, both price indices for imports and exports in April recorded their smallest drop since the beginning of 2015.

The US economy currently is presenting a brighter outlook in terms of a recovery, and the markets are optimistic on upcoming data releases. April core retail sales are forecast to increase 0.6% from a 0.2% rise in the month prior. Producer price index is also expected to inch up 0.3%, after sliding 0.1% previously. The US dollar is expected to stay strong in the near future, the data reinforces market expectations.


eurusd-d1-1-1024x502.png

Fig. EURUSD D1 Technical Chart

The USD is on track to strengthen against the euro since the past few sessions. EURUSD is tumbling from the resistance of 1.16154 formed on May 03, the highest level since August 2015. However, the signal trend indicator still encourages a long position as the green trend indicator arrow has appeared under the price chart. The level 38.2% of Fibonacci retracement is anticipated to turn into a support for the price.

Trade suggestion

Buy at 1.13638, Stop loss at 1.13067, Take profit at 1.14312
 
Top