S.R.G.
Junior member
- Messages
- 30
- Likes
- 0
Hello traders,
I am about to refine my trading and need to feel a bit more accountable 😱 , don't we all!
So before I start I would like to ask fellow Trade2Win members if there is any interest in me starting a new thread for this?
This would in that case be the rules:
FYI - Please read:
I am about to refine my trading and need to feel a bit more accountable 😱 , don't we all!
So before I start I would like to ask fellow Trade2Win members if there is any interest in me starting a new thread for this?
This would in that case be the rules:
FYI - Please read:
If enough people think this could be interesting and no one opposes (oh no, not another one...) I will start of on Monday morning: 2005-04-25.
This will not be a live/direct trade/post thread since I am focusing on trading, nothing else. So I will try to update each day's trades with screen shots and comment sometime past 17:00GMT.
Hopefully will this thread be of enough interest to fellow forex traders, to follow along by offering their comments/questions and keeping me accountable 😉 .
Time frame (glaring time):This will not be a live/direct trade/post thread since I am focusing on trading, nothing else. So I will try to update each day's trades with screen shots and comment sometime past 17:00GMT.
Hopefully will this thread be of enough interest to fellow forex traders, to follow along by offering their comments/questions and keeping me accountable 😉 .
mostly 06:00-13-14:00 GMT
Account: Live - GFT
Maximum Draw down: $Max 75 (25pips)
Size @ position: 3 lots @ fade in
Currency: EUR/USD
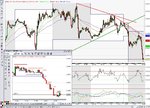
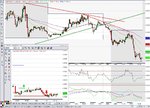
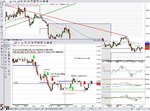
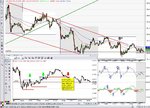
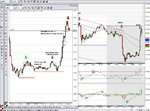
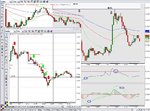
Price is displayed as:Candlestick
Time frames: 60min - Trend, Fibonacci, shortMACD
15min - Price action, %B(a relative momentum indicator), shortMACD(8/12),
EMA 20,50,100
EMA 20,50,100
5 min - When fading/managing the trade.
My thoughts of trading:Trading is not science or just "feeling lucky", it should be an evaluation of probabilities. What indicators (or not) you use should actually not matter as long as you keep on using them long enough so you can start identify re-occurring scenarios. i.e. before price will go up, most of the times, the indicator/s (price action) will look like this a.so. So probability will be on your side, price action sets the final decision when the trade will trigger.
Strategy: Sit tight and wait until either:
A. %B >1 or <0
B. MMACD is around h/l areas of old reverse points.
Action:
Buying/adding on break out of prev high/low or 5min congestion area with support of MMACD, %B
Hard targets, just to be avare of:
Pivot Point
Even numbers 00's and 50's
Daily/weekly/monthly h/l's
>60min Chart Fibonacci levels
100% Range
Exits
Initial S/L -> manually trailing placing below/above 5min congestion.
Main focus is on average break even.
On BUY orders or S/L - remember the +3 pip spread.
Main focus is on average break even.
On BUY orders or S/L - remember the +3 pip spread.
Additional
News releases:
Do not enter new trade 60 min before major news release.
Do not enter new trade 60 min before major news release.
No action:
If trade does not turn profitable within 10 x 5min bars. Tighten S/L max
If trade does not turn profitable within 10 x 5min bars. Tighten S/L max
Adding of positions:
Maximum positions 3 x 3lots (at present)
Maximum positions 3 x 3lots (at present)
Last edited: