clylbw
Well-known member
- Messages
- 454
- Likes
- 4
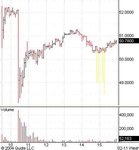
Hi,
Wonder if someone did CTSH today.
I was unable to watch the market until almost the end, and I wonder what actually happened during that five long spikes of it today (please refer to the attached chart).
The first one happened just before 10:30 am EST. My ex post research seems to indicate that this was caused by the news of the issuing of its conference call guidance, and confirmed by high volume. It looks like a 'genuine' spike.
However, there the remaining 4 spikes, 2 just before and 2 after 3:00 pm EST, seemed to have come from nowhere, with neither the cause of news nor the confirmation of volume. They looks like 'fakes' to me (sorry I do not know the correct terms for them, but hopefully I have made myself clear... 🙄 ).
What I would like to know is:
1. Did any TA indicators or the Level II information signal about any of the spikes beforehand?
2. Is it possible to tell those 'genuine' spike from the 'fakes'? If so, how?
3. How can I know more about the cause, the signals and the implications of spikes?
So, can you please advise me about the spikes of CTSH today, or about the general circumstances regarding the spikes? Thank you indeed. 😀