Crude oil daily targets (also weekly)

Tradersonflow

Member
Messages
61
Likes
1
Hello,

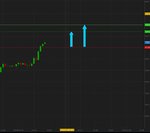
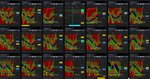
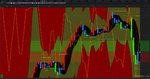
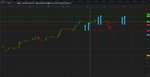
I will post the direction crude will go (or is likely to), daily, along a few charts. Will also be useful as I will detail and analyse the "why" in case of different outcome.
 
From July 2nd to July 3rd


Hello, Open at 46.2.
I expect 46.6 to 47 to be reached around Monday 3rd noon time.
A move down below the 46 area would probably change this forecast, but I expect price to go straight up off the open.

Based on my trading tools and slight knowledge of the market, a few years.

From July 2nd to July 12th +-

Let's expect crude to reach 49.50 or so.
A move below 45 would change things, however I don't expect it.
So that would be a 100tick SL to 300 tick TG from the open at 46.2.

However It is not recommendable, better take several longs along the way if they happen with few-tick stop losses as the plan might be invalidated.

Please see pictures attached.
 

Attachments

  • crude 1.JPG
    crude 1.JPG
    58.3 KB · Views: 417
  • crude11.JPG
    crude11.JPG
    506.5 KB · Views: 452
Last edited:
There you have, it is 11.40 am.The day after


And the funny thing is I overslept and took none of that, cause trading is boring, pretty shameful tbh,
500$ [or even 1000$ with only 2 contracts] in one day, announced 12 hours before.,
 

Attachments

  • crude111.JPG
    crude111.JPG
    114.4 KB · Views: 432
Last edited:
July 4th

July 4th activity may decrease a slight bit due to holidays, but I still believe oil is bullish and oughtta reach 47.60/47.80 if not slightly higher.

Currently at 46.80, Below 46.60 I don't see anything at the moment. Wait till tomorrow morning to confirm. Well, everything summed up in the charts. Let's see.
 

Attachments

  • crude2.JPG
    crude2.JPG
    129.1 KB · Views: 436
  • crude22.JPG
    crude22.JPG
    378.4 KB · Views: 358
Got something interesting here.
This model I made is kind of telling me we have a potential 5tick stop loss for a 60 tick objective.
as picture suggests we are at 46.91
So SL would be 46.86.
it is 7.10 eastern time

Basically it shouldnt go below the first blue line.
Watch your charts.
 

Attachments

  • crude4.JPG
    crude4.JPG
    179.6 KB · Views: 429
Should be Okay
5 tick Stop Loss for a current 30 tick profit.
R:R about 1/6.
Ideal R:R 1/18
 

Attachments

  • cr444.JPG
    cr444.JPG
    137.4 KB · Views: 419
  • cr4444.JPG
    cr4444.JPG
    158.5 KB · Views: 411
Last edited:
July 5th

Thinking about this but Id probably need to review in a couple of hours, seems okay but it depends on the day.
 

Attachments

  • 3.JPG
    3.JPG
    141.6 KB · Views: 389
Dropped during the night, plan is to be revised.
Prolly expecting price to go back up.
 

Attachments

  • 4.JPG
    4.JPG
    194.6 KB · Views: 393
Well plan was completely off, so stayed out of M.
S/R zones played good though
 

Attachments

  • 3-b 0t.JPG
    3-b 0t.JPG
    124.9 KB · Views: 391
July 7th

hmm maybe ? Anyway the lines should be able to play a role in either ways
 

Attachments

  • 4.JPG
    4.JPG
    136.1 KB · Views: 429
Crude oil WTI

Crude oil is in wave [4]. We should find the best place to prepare for upcoming wave [5] down. Chart below
shows current situation from a medium term view.​
oil22.png
As we can see
any pullback toward Fibonacci level 0.618 of wave [3] length is a good place to SELL. This short
position should be held until the end of wave [5]. Wave [5] will start anyway, and any SELL inside
wave [4] space will eventually, bring some profit.
We wait for a high pullback in three waves to prove our assumptions. SELL position could be
established at the end of this pullback, preferably in a target space.​
oil32.png
Chart above - probable first wave down and a current correction, SELL at the correction end.​
We have a full review, where we estimate wave [4] form, awaited fall targets and trading tactics
in details. As usual we track crude oil and all other markets daily.​
 

Meanwhile crude oil goes its way, making our previous assumptions out
of date.​
oil41.png


Yes, upward move was in sequence [a]--[c], which is a correction,
and this correction is over by our count. The last wave in wave [c] has
failed to make a new top. First move down can be counted as an inital
triangle, strongly suggesting, that move down has already started. Time
to SELL, current pullback is offering a suitable possibility.


We wait for a downward move on crude oil. Either wave [5] has al-
ready started or any sizeable downward part of wave [4] is running.
You can read more about price targets and trading tactics in our crude
oil short term view.​
 
Top