You are using an out of date browser. It may not display this or other websites correctly.
You should upgrade or use an alternative browser.
You should upgrade or use an alternative browser.
Best Thread Correlation Trading - Basic Ideas and Strategies
NVP
Guest Author
- Messages
- 37,968
- Likes
- 2,158
NVP
Guest Author
- Messages
- 37,968
- Likes
- 2,158
Hey all
people do ask me a lot about Forex Strengthmeter products and services out there in the trading cosmos .....and one day I might even write some articles or even an e-book about how Strengthmeters work....and i mean how they really work and the benefits they can bring to supporting trading decisions or even form 90%+ of your trading strategies (like my approach)
Meanwhile if you put me on the spot....Tom Yeomans Strengthmeter prodcuts have been out there since the early 2000's ....hes one of the pioneers and whilst I have never bought anything (or affiliated) with him and his products....I know how they work
(well it would be pretty sad if I didnt - given my time on this thread and my years of research in strengthmeters 😉 )
So heres Tom......his products are worth a look if you are gonna pay $$'s but I have to say you will be paying for his ideas and not the software....in truth my Free FXcorrelator available here or at my Website (see my home page) is all you need for foundation Strengthmeter analysis - and with the right settings (and tweaks) it can replicate pretty much any fancy System or indicator out there you see...(yep its true....the FXCorrelator is a CHART...so i'm not sure where Tom is coming from below when he states that the Accustrength is unique... 😎)
ask me here about anything and I am happy to discuss how the FXcorrelator can help with what you want to do
so heres Tom with a recent push e-mail to customers and again I have no affiliation or relationships with that Crew....
over over to you tom... :smart:
N
Hi everyone.
In answer to several emails I thought i would cover it in this weeks letter.
We have two Forex software products. Both are stand-alone windows programs that display currency strength on a chart. That is the difference between my products and all the others. They are charts. Everything else is like a digital stopwatch meter or an addon.
No! Henry (Liu) did not steal my code for his meter! I have been giving away open code spreadsheets for years. We have talked a few times by email and I had no problem when he gave away one of my spreadsheets a few years ago. His new stopwatch meter is his design. I have often considered advertising on it.
There were many bright contributors to the coding of my currency strength tools after I moved from a tick type spreadsheet. When the power of the software dwarfed my programming abilities, I searched the world and hired the brightest developers I could find to do the coding and bring about the features I personally wanted for a tool I used everyday. (Sales took a back seat.) I opened an office and began filling it with superbright people. We designed the best currency strength tool I wanted first. Then I began sharing it.
There are many types of currency strength measurement tools around and I would think that each has its own applications. Which brings us back to mentioning our products are charting platforms. Not tick meters. Free meters and strength services have their own audience of traders.
I do not give away my products or services. (People who need to acquire things free in this business have a plethora of marketers to serve them.)
A... The 2.44 sells for fifty dollars and uses a free MT4 data feed. This product has sold for as much as $900 USD in the past but has been superseded by the AccuStrength. The 244 represents fantastic value in software without a recurring cost.
B... The AccuStrength was designed for professional Forex traders. (People with money on the line.) The AccuStrength is normally sold by subscription, which means that I expect our clients to be around for years, not months. It has history and a multitude of features that people who use this tool everyday expect.
So,
Beginners and demo account holders can start with the 2.44 Strength Chart if trading with individual currency is new. The charts work with all brokers and all forex trading systems. I have priced the powerful 244 software platform for traders who are learning or paper trading. Once they see the need for an individual currency strength chart, they will click the little help button inside the 244 and end up subscribing to the feature laden AccuStrength.
Forex Grail -- The Incredible New Trading System
Currency Strength Meter
Contact [email protected]
Tom Yeomans
NVP
Guest Author
- Messages
- 37,968
- Likes
- 2,158
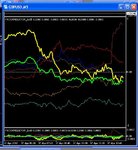
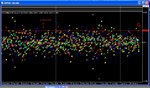
The land of ther Rising yen in April ?
the (Yellow) Yen is creaming all other currencies so far this month....hmmm 😏
N
all change this week ..........the rising Yen finally secumbed to the Rising dow !
Nice moves yesterday ....sure the USD fell but boy oh boy the volatility was with the Yen
and as I mentioned yesterday the Economic news on the CAD got it the best move north of the day !
N:smart:
Attachments
NVP
Guest Author
- Messages
- 37,968
- Likes
- 2,158
hey all
i'm rummaging through some old files/links at the moment clearing out one of my laptops
heres one ......its pretty basic but quite a lot of good free info there
I have no affiliations with the vendor here
Strat's Forex Trading Education [Forex Training]
N:smart:
i'm rummaging through some old files/links at the moment clearing out one of my laptops
heres one ......its pretty basic but quite a lot of good free info there
I have no affiliations with the vendor here
Strat's Forex Trading Education [Forex Training]
N:smart:
NVP
Guest Author
- Messages
- 37,968
- Likes
- 2,158
oh yeah....found it !
someone told me recently that they had a great system delivering 60+% win rates and they were increasing their risk per trade as the chances of a losing streak (5+) were very very minimal
try this here as an example.......
http://www.sbrforum.com/betting-tools/streak-calculator/
top line type in (say) 200days a year X 3 trades a day = 600 (trades per year)
Type in the losing streak you are predicting in middle line - (say 6)
and then type in the % chance this will happen ( = 100%-60% win rate = 40% lose % rate)
600
6
.40
answer ?........a 77% chance of having a consistent run of 6 successive losses in a 600 trading sample
(10 losses in a row is 4%......still a possibility ?)
Gulp !!.........see how losing runs are not uncommon.... even in a good % strike rate ?
so dont beat youself up tooo much guys !
and dont increase your Risk per trade either....Probability will get you in the end...always does !
N
NVP
Guest Author
- Messages
- 37,968
- Likes
- 2,158
I found this as well ....dammed if i know what it means though !
N
http://daytradinglife.com/wp-conten...iple-losing-streak-probability-calculator.pdf
N
http://daytradinglife.com/wp-conten...iple-losing-streak-probability-calculator.pdf
NVP
Guest Author
- Messages
- 37,968
- Likes
- 2,158
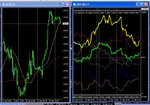
Funny week this week
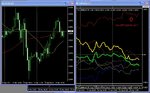
Yen is the odd one …..its decided to fall all week despite the Dow pushing back south in last day or so ….
and the GBP has been magnificent off some solid economics……..and thats all it needs these days ….an absence of bad news means the currency will bat well for a while at least ….!
(the GBP has picked up the Aussie (non) votes as well this week....)
In My FXcorrelator VIP site I always called the plays for Fridays… which are pretty easy to call outside of the NFP days….
why ?
because inevitably if money is on the table from big moves in the week then the stops are there to protect traders …and the Stop hunt begins and ends on Friday !
have a good weekend
Neil
(NVP)
Attachments
Last edited:
NVP
Guest Author
- Messages
- 37,968
- Likes
- 2,158
and as for todays trades ?
Well a little difficult as the big weeks move on the Dow has lost a high % of its gains already
all I will say is that the GBP has made a big big gain this week (the last Gain of this size was in sep 2011)….so dont hold your breath for more today
but what do i know ?....always trade what you see !
N
NVP
Guest Author
- Messages
- 37,968
- Likes
- 2,158
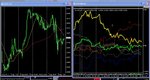
we're at the US Session now and
WOW !
the GBP (Red) has kept coming North......ok the dow(left chart) is rising still....and YEN(yellow) and USD(Green) are predictably falling so it was correlation consistent.... but all in all a great week for the GBP
(let me get my holiday money out !)
Euro (blue) is tracking it though so not so much action on that pair as was being predicted for today by some people 😉
later today - if the dow catches a cold the GBP may take a big big fall on the tightening stops in place....
so a little Selling of the G/U and G/Y may be very very lucrative into the last hours of the week..but wait for some decent signals
I love this business.....!!
N
Attachments
NVP
Guest Author
- Messages
- 37,968
- Likes
- 2,158
hey all
Great week for the ole GBP…..!
the Dow never caved yesterday (such is life) so this helped keep the GBP up there ….
heres the Xmen model – available here
http://www.trade2win.com/boards/for...-basic-ideas-strategies-1068.html#post1801140
its set on 1 ma and heres the weekly with the Red X being the GBP
so each x is a weekly performance bar
its a simple version of the FXCorrelator and you see exactly how the currencies have performed without those messy lines I use !
I use these a lot in my trading now….
the last time that red horizontal got breached was October 2010……yep nearly 18 months ago
you will read a lot about the GBP over the weekend re its strength…but remember its always about comparing it to other currencies as pairs (eg the GBPUSD is at a high of x% etc etc)…..
The FXcorrelator always tells you what individual Currencies are doing ….I dont give a damn about the USD’s strength or weakness until I want to look at it on its own and I certainly cant see what the GBP is doing by pairing it with anything .....so the GBPUSD pair strength or weakness means nothing to me…its a mixture of 2 currencies and I cannot see each ones True movement
I just follow the Truth of individual currency performance to give me the clues on which to buy and which to sell !
Paircharts are just for making trades for me ....
N
Attachments
NVP
Guest Author
- Messages
- 37,968
- Likes
- 2,158
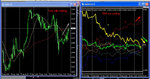
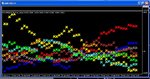
Heres the more usual FXcorrelator on a 500ma setting I think ....
the GBP held on the day .....but only with a lot of Dow push to keep it up there...and actually the Blue Euro had a stronger day overall
(in Forex a currency will only fool all of the people some of the time 😉)
anyway a great week if you were GBP bullish
Rule Britannia ! 👍
N
the GBP held on the day .....but only with a lot of Dow push to keep it up there...and actually the Blue Euro had a stronger day overall
(in Forex a currency will only fool all of the people some of the time 😉)
anyway a great week if you were GBP bullish
Rule Britannia ! 👍
N
Attachments
NVP
Guest Author
- Messages
- 37,968
- Likes
- 2,158
hey all
If you track back through this Thread you will see I am a big big Fan of Andy's 3 ducks trading system 👍
Why ?
because it focuses on the things needed to be successful in trading
Simple and understandable system
Straightforward rules
Robust execution strategy and ideas
I dont think I have fused my FXcorrelator Xmen indicator into the 3 ducks before but I attach it here if anyone is interested :smart:
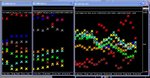
its an Xmen with the 60ma setting and on this chart below you see the 3 TF's that Cap teaches you to watch
see how dominant the GBP (red) has been in the left higher TF's ?***
Thats the Master currency and the one you should be trading when it is above another currency in all 3 TF's shown.....but now I am straying into Caps method and thats not my realm so go to his Thread to learn
and by the way ...the weakest currencies are the yellow yen and the Turquoise NZD on the left hand chart shown
again they are the dudes to be watching and selling against anything they are below in all 3 TF's ....
again I drift into Caps world but I just wanted to show how the Xmen makes this perhaps a little simpler to see :smart:
N
(***Gee - I think i might have also mentioned the power of the GBP this week on this humble thread ?)
If you track back through this Thread you will see I am a big big Fan of Andy's 3 ducks trading system 👍
Why ?
because it focuses on the things needed to be successful in trading
Simple and understandable system
Straightforward rules
Robust execution strategy and ideas
I dont think I have fused my FXcorrelator Xmen indicator into the 3 ducks before but I attach it here if anyone is interested :smart:
its an Xmen with the 60ma setting and on this chart below you see the 3 TF's that Cap teaches you to watch
see how dominant the GBP (red) has been in the left higher TF's ?***
Thats the Master currency and the one you should be trading when it is above another currency in all 3 TF's shown.....but now I am straying into Caps method and thats not my realm so go to his Thread to learn
and by the way ...the weakest currencies are the yellow yen and the Turquoise NZD on the left hand chart shown
again they are the dudes to be watching and selling against anything they are below in all 3 TF's ....
again I drift into Caps world but I just wanted to show how the Xmen makes this perhaps a little simpler to see :smart:
N
(***Gee - I think i might have also mentioned the power of the GBP this week on this humble thread ?)
Attachments
Last edited:
NVP
Guest Author
- Messages
- 37,968
- Likes
- 2,158
and heres the last 10 days or so on the 4hour TF setting which is Andy's highest setting he uses to guide the system
I'm sure Andy has been priming his crew on (red) GBP buys for a while now....and you can see he will have not dissapointed them this week !
Thats why its a good system......
oh yeah and why the FXcorrelator is such a great way of seeing what the market is doing :smart:
N
I'm sure Andy has been priming his crew on (red) GBP buys for a while now....and you can see he will have not dissapointed them this week !
Thats why its a good system......
oh yeah and why the FXcorrelator is such a great way of seeing what the market is doing :smart:
N
Attachments
NVP
Guest Author
- Messages
- 37,968
- Likes
- 2,158
A couple of posts over at caps thread supporting some great calls this week
http://www.trade2win.com/boards/for...8-3-ducks-trading-system-255.html#post1835138
http://www.trade2win.com/boards/for...8-3-ducks-trading-system-255.html#post1835138
NVP
Guest Author
- Messages
- 37,968
- Likes
- 2,158
hey all
i'm getting a few PM's about if i trade the 3 ducks ....
well to be truthful no.......
my posts were just showing that :-
1) its a good system and I recommend people looking at it - especially someone who is inexperienced and looking for a robust MA based system that has solid rules and proinciples
2) the FXcorrelator is a multipurpose indicator that can be used to show market dynamics very very effectively
look through the thread and contact me if necessary........I have offered up my 80/20 system as a core system for traders to learn the ropes
but when you have worked with me long enough and seen my ideas and approach you will see there are many ways to use the Tool to get success !
There are 3 "things" in Trading ...
I call it THE TRADING TRINITY
1) the Market
2) The system
3) the Trader
1) is always right and the other 2 are always work in progress...ALWAYS....if you want to be the best you can be
and yes the real real problem with being a newbie (in fact most people in truth) is that a lot of the time if you are losing money in trading you are not sure if its you or your system that is the problem...(2 or 3 )
so what do you do ?
you keep changing both dont you.... ! 😆
so dont sweat it tooo much.... we are all in that place sometimes
thats why you will see me recommend the following approach to newbies
1) pick a (Free) system that seems to do ok....anything ...go to the big threads here and find one with a lot of views ...that means they are followed and have stood the test of time.........if in doubt use a ma based method...perhaps with a little price action rules to keep it really simple
i'm happy to put one out there if you want ....
then trade it until you are an expert at the processes of being a good Trader (number 3 in the list).....and you cant blame the system as its stood the test of time !
but it loses sometimes NVP..even a lot.....
SO DO ALL SYSTEMS ! 😱
you cannot perfect yourself and your processes (3) as a newbie without a solid system.....once you are a solid and proficient trader then start persuing that holy grail (haha !)
believe it or not a very very proficient trader can do ok even on an average system.....because they always do the right things at the right time :smart:
N
Last edited:
Similar threads
- Replies
- 0
- Views
- 4K