You are using an out of date browser. It may not display this or other websites correctly.
You should upgrade or use an alternative browser.
You should upgrade or use an alternative browser.
Best Thread Correlation Trading - Basic Ideas and Strategies
jrplimited
Active member
- Messages
- 249
- Likes
- 1
Hi N and anyone else out there,
Apologies for intermittent postings (or should that read ramblings?!!) lately, I see I've been missing out on all the fun....
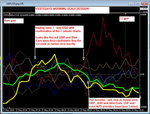
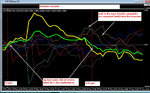
GU; First trade long entered at 44997 on open 08:05 bar, price shot upwards by over 35 points then fell down again to take out adjusted SL for 12 point loss during 08:35 bar. Second trade sell stop at 44692 filled by end 09:15 bar, price crawled down then chart got very confused so trade abandonded during 09:40 bar for 3 point profit. Third trade buy stop at 44884 filled during 10:00 bar, price caught momentum train and sprinted north, paused for two bars then 10:30 bar pushed it up again, followed by another pause and a fairly tight consolidation range with new 11:10 local high print, then it went into sleep mode and eventually flopped down taking out TS with tail of 11:40 bar for 53 point profit.
EU; First trade long entered at 23266 on open 08:05 bar, price moved reluctantly up then keeled over taking out SL during 08:20 bar for 18 point loss - top fishing didnt work there then! Second trade sell stop at 22494 filled by tail of weak 09:25 down bar, price bounced away from entry level and hovered around for seven bars then 10:05 bar took out SL for 18 point loss - so, bottom fishing failed miserably as well!
EG; Had to wait until 09:50 bar for first trade, sell stop at 84698 filled during this and price picked up speed moving down, paused for three bars then 10:30 bar punched down once more but after that things seemed to just run out of steam and price drifted upwards again taking out TS during 11:15 bar for 22 point profit.
Very weird day on EU chart as although price was clearly in freefall after first trade, no flags were raised so that cost me dearly in terms of missed out points. Indecision was yet again the name of the game this morning so watch out during afternoon session - trade well and regards,
Simon.
Apologies for intermittent postings (or should that read ramblings?!!) lately, I see I've been missing out on all the fun....
GU; First trade long entered at 44997 on open 08:05 bar, price shot upwards by over 35 points then fell down again to take out adjusted SL for 12 point loss during 08:35 bar. Second trade sell stop at 44692 filled by end 09:15 bar, price crawled down then chart got very confused so trade abandonded during 09:40 bar for 3 point profit. Third trade buy stop at 44884 filled during 10:00 bar, price caught momentum train and sprinted north, paused for two bars then 10:30 bar pushed it up again, followed by another pause and a fairly tight consolidation range with new 11:10 local high print, then it went into sleep mode and eventually flopped down taking out TS with tail of 11:40 bar for 53 point profit.
EU; First trade long entered at 23266 on open 08:05 bar, price moved reluctantly up then keeled over taking out SL during 08:20 bar for 18 point loss - top fishing didnt work there then! Second trade sell stop at 22494 filled by tail of weak 09:25 down bar, price bounced away from entry level and hovered around for seven bars then 10:05 bar took out SL for 18 point loss - so, bottom fishing failed miserably as well!
EG; Had to wait until 09:50 bar for first trade, sell stop at 84698 filled during this and price picked up speed moving down, paused for three bars then 10:30 bar punched down once more but after that things seemed to just run out of steam and price drifted upwards again taking out TS during 11:15 bar for 22 point profit.
Very weird day on EU chart as although price was clearly in freefall after first trade, no flags were raised so that cost me dearly in terms of missed out points. Indecision was yet again the name of the game this morning so watch out during afternoon session - trade well and regards,
Simon.
Attachments
NVP
Guest Author
- Messages
- 37,968
- Likes
- 2,158
Hi N and anyone else out there,
Apologies for intermittent postings (or should that read ramblings?!!) lately, I see I've been missing out on all the fun....
GU; First trade long entered at 44997 on open 08:05 bar, for 12 point loss during 08:35 bar. Second trade sell stop at 44692 filled by end 09:15 bar, price crawled down then chart got very confused so trade abandonded during 09:40 bar for 3 point profit. Third trade buy stop at 44884 filled during 10:00 bar, price taking out TS with tail of 11:40 bar for 53 point profit.
EU; First trade long entered at 23266 on open 08:05 bar, price moved reluctantly up then keeled over taking out SL during 08:20 bar for 18 point loss - top fishing didnt work there then! Second trade sell stop at 22494 filled by tail of weak 09:25 down bar, price bounced away from entry level and hovered around for seven bars then 10:05 bar took out SL for 18 point loss - so, bottom fishing failed miserably as well!
EG; Had to wait until 09:50 bar for first trade, sell stop at 84698 filled during this and price picked up speed moving down, paused for three bars then 10:30 bar punched down once more but after that things seemed to just run out of steam and price drifted upwards again taking out TS during 11:15 bar for 22 point profit.
Very weird day on EU chart as although price was clearly in freefall after first trade, no flags were raised so that cost me dearly in terms of missed out points. Indecision was yet again the name of the game this morning so watch out during afternoon session - trade well and regards,
Simon.
hey mate - better fishing this afternoon 😎
stuffed at work and also some personal admin/chores backlog so will post when i can 🙁
N
NVP
Guest Author
- Messages
- 37,968
- Likes
- 2,158
Normal service resumed in 2012 ?
Hi all
ooh dear the cotton monster has truly descended like a giant blob on my head.....I will be totin cotton non stop for days just to catch-up 🙄
will try to post or respond to pm's but sorry in advance for next few days and early into next week.......
no cotton bailed = no paycheque and my horrific renditions of the camptown races wont get me into x-factor celebrity reject money till next year now .....😛
later.....much later dudes :whistling
N
NVP
Guest Author
- Messages
- 37,968
- Likes
- 2,158
NVP
Guest Author
- Messages
- 37,968
- Likes
- 2,158
and here was the pm fun.....
1st trades (buy USD) monster sells on gbp,NZD and CAD but boy the 1 mins had to be right
2nd trades (sell usd).......there were big tribal biases so it meant being smarter with trades ....buying the Eurozone later on were the trades but it was initialy a tricky wave of activity
the scalper is available free in earlier posts made this week (or go to my pm page)
my Free pdf detailed documetation on how to use the scalper will be available as soon as i can get a minute to finish it !! 😛
later dudes and good luck today 👍
N
Attachments
NVP
Guest Author
- Messages
- 37,968
- Likes
- 2,158
jrplimited
Active member
- Messages
- 249
- Likes
- 1
Hi N and anybody else,
Yipeee its Friday! Time to break open the laughing juice and blot out this week's rather ragged trading performance, here is what I saw during this morning's session....
GU; First trade short entered at 45564 on open 08:15 bar, price found momemtum and moved down to new 08:55 local low print, then did a surprising sharp turnaround and took out TS with wick of 09:05 bar for 23 point profit - that particular reversal move went onwards but chart couldnt locate any setups until long entry at 45716 on open 10:45 bar, price crawled up, stopped then jumped up to new 11:20 local high then gave up the ghost and dropped down taking out TS during 11:35 bar for 13 point profit.
EU; First trade short entered at 23421 on open 08:10 bar, price stalled then moved down, recovered and did another move down then recovered again with some force and took out TS at breakeven level for zilch point profit. Second trade buy stop at 23656 filled by strong 09:10 up bar, price moved nicely northwards then ran out of steam and took out TS during 10:05 bar for 42 point profit - done for the day on this pair.
EG; Price action was running well ahead of chart for first hour then first trade found with buy stop at 85158 filled by 09:10 bar, price faltered then pushed up but couldnt hold highs and took out TS during 10:10 bar for 9 point profit. No other setups flagged and chart got a bit confused to boot.
Talk about an unsettled and very undecided market, we seem to be bouncing up and down the hills lately and some of the spreads on G and E have been rather wide at times, reinforcing these volatile conditions - trade well and regards,
Simon.
Attachments
NVP
Guest Author
- Messages
- 37,968
- Likes
- 2,158
Hi N and anybody else,
Yipeee its Friday! Time to break open the laughing juice and blot out this week's rather ragged trading performance, here is what I saw during this morning's session....
GU; First trade short entered at 45564 on open 08:15 bar, TS with wick of 09:05 bar for 23 point profit - that long entry at 45716 on open 10:45 bar, TS during 11:35 bar for 13 point profit.
EU; First trade short entered at 23421 on open 08:10 bar, TS at breakeven level for zilch point profit. Second trade buy stop at 23656 filled by strong 09:10 up bar, TS during 10:05 bar for 42 point profit - done for the day on this pair.
EG; Price action was running well ahead of chart for first hour then first trade found with buy stop at 85158 filled by 09:10 bar, price faltered then pushed up but couldnt hold highs and took out TS during 10:10 bar for 9 point profit. No other setups flagged and chart got a bit confused to boot.
Talk about an unsettled and very undecided market, we seem to be bouncing up and down the hills lately and some of the spreads on G and E have been rather wide at times, reinforcing these volatile conditions - trade well and regards,
Simon.
hmm - a nice mixed bag full of pips there from the stigmaister......enjoy the weekend mate 👍
back to the cotton pickin for me till dusk.....sigh
N
Hi folks
still bumbling about, two steps forward, one step back:
http://www.trade2win.com/boards/trading-journals/91616-icc-forex-system-testing.html#post1139260
Enjoy the weekend...another bank holiday already!
- Gavin
still bumbling about, two steps forward, one step back:
http://www.trade2win.com/boards/trading-journals/91616-icc-forex-system-testing.html#post1139260
Enjoy the weekend...another bank holiday already!
- Gavin
NVP
Guest Author
- Messages
- 37,968
- Likes
- 2,158
Hi folks
still bumbling about, two steps forward, one step back:
http://www.trade2win.com/boards/trading-journals/91616-icc-forex-system-testing.html#post1139260
Enjoy the weekend...another bank holiday already!
- Gavin
join the club..........still picking the cotton and no respite yet till dusk...
holidays are great ...its the coming back and the backlogs thats a problem 😛
have great weekends all 👍
N
Hi everyone,
been a while - have to take a break from Forex at the moment because of interference with my day job. Will hopefully be in calmer waters soon.
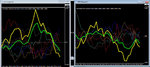
Either way, I had a bit of spare time today and Neil said it would be cool to see the corrie as candlestick chart. Did just that, attached is a screenshot. Not sure if it provides any real value... I think the prices do not vary enough to justify the candlestick analysis.
Let me know what you think. Still working on the code, the drawing functions in MT4 are quite primitive.
Till
been a while - have to take a break from Forex at the moment because of interference with my day job. Will hopefully be in calmer waters soon.
Either way, I had a bit of spare time today and Neil said it would be cool to see the corrie as candlestick chart. Did just that, attached is a screenshot. Not sure if it provides any real value... I think the prices do not vary enough to justify the candlestick analysis.
Let me know what you think. Still working on the code, the drawing functions in MT4 are quite primitive.
Till
Attachments
alan5616
Established member
- Messages
- 935
- Likes
- 200
Hi everyone,
been a while - have to take a break from Forex at the moment because of interference with my day job. Will hopefully be in calmer waters soon.
Either way, I had a bit of spare time today and Neil said it would be cool to see the corrie as candlestick chart. Did just that, attached is a screenshot. Not sure if it provides any real value... I think the prices do not vary enough to justify the candlestick analysis.
Let me know what you think. Still working on the code, the drawing functions in MT4 are quite primitive.
Till
Nice job, Till. You've created the opportunity for us to see Corrie from a different dimension.
As you say, the prices do not vary enough, on EUR/GBP, to justify candlestick analysis. The average daily range is around 70 pts. Neil describes EG as "the Eurotribe" for the reason that they have a close correlation.
It would be very interesting to see what a c/stick chart would look like for a pair that has a far larger daily range, such as EJ, EU, GJ & GU. The best profit opportunities, on short tfs, come from high volatility. Corrie is a class apart from most other indicators, in these conditions.
jrplimited
Active member
- Messages
- 249
- Likes
- 1
Hi everyone,
been a while - have to take a break from Forex at the moment because of interference with my day job. Will hopefully be in calmer waters soon.
Either way, I had a bit of spare time today and Neil said it would be cool to see the corrie as candlestick chart. Did just that, attached is a screenshot. Not sure if it provides any real value... I think the prices do not vary enough to justify the candlestick analysis.
Let me know what you think. Still working on the code, the drawing functions in MT4 are quite primitive.
Till
Hi Till,
Nice one and very clever. I was PMing Neil about this a few weeks ago as the guy that does all my mt4 coding for me was looking at this and sent me a few examples which highlighted the problem of scale, in that using [say] an M5 tf (constructed with M1 tf for OHLC data array) then the variances of E, G and U etc get rather wild in variances - something Alan mentiond in post above.
Is it possible for you to re-visit the scale and maybe re-base this? Neil will be hyper excited at what you have done so far, its absolutely brilliant and well done.
Best regards and enjoy the holiday weekend,
Simon
alan5616
Established member
- Messages
- 935
- Likes
- 200
What is the problem exactly? You mean that the corrie-prices range between for example -0.0001 and 0.0001 on M5 and between -0.01 and 0.01 on H1? (I don't know how to describe it better - prices are an order of magnitude smaller on smaller timeframes)
Attached is another screenshot, this code can now display all currencies and does autoscaling, so if you change the timeframe or add/remove currencies, the indicator window will scale to optimally fit the contents, just like the regular line-style indicator.
Two things are left, 1) on some candles the high/low prices do not overlap with the open/close prices (must be some odd calculation problem) and 2) because the markets are closed at the moment, I don't know what happens when live prices come in... probably the last candle will not update correctly.
Till; you've done a great job on this. I'm fairly certain that what you have developed is ideally suited for individual pairs, rather than a combination of currencies. Just my opinion as I am clueless on the subject of MT4 programming.
NVP
Guest Author
- Messages
- 37,968
- Likes
- 2,158
Hi all
hyperexcited is not the word.....I am in orgasmic orbit :clap:
Till if you knew my private trading systems you would realise how valuable this new breakthrough is.....we now have full price action analysis for individual currencies presumably on any Timeframe
See my pm and we will have a private blog available later this week for more discussion - all the usual culprits here will be copied re access ......and Alan has some further ideas that we need to persue
I will also reveal my humble ideas that will end in the commercial arena to our followers soon....you'll like them and see my excitement re this new candlestick development as it will supercharge them re their effectiveness in price action analysis
truly unbelievable work my friend......a quantum leap in stengthmeter technology 👍
wow !!!!!
N
Last edited:
alan5616
Established member
- Messages
- 935
- Likes
- 200
Some people can't be helped
As a follow up to the excellent job that Till has done on the candlestick conversion of Corrie, I'd like to relate my experience of, recently. testing a trading system for a friend of mine, who is an MT4 programmer.
He is desperate to trade succesfully but, has blown 3 trading accounts in the past month. In brief, his latest "dog's bo**ocks mate" system is useless. All based on lagging indicators. It works great on back test but, one of his indies does a mega repaint so, it's not worth a light. I have tried to convince him that Corrie is where he should be looking for inspiration but, my words have fallen on deaf ears. There's no hope for some people.
alan5616
Established member
- Messages
- 935
- Likes
- 200
NVP;1140256 hyperexcited is not the word.....I am in orgasmic orbit :clap: N[/QUOTE said:I hope you haven't told your missus that you're in this state because of a girl called Corrie🙂
NVP
Guest Author
- Messages
- 37,968
- Likes
- 2,158
I think the key is this my friends
number 1 - the FXCorelator is really not an indicator per se
it is a simple index representation of each individual currency in chart format as calculated from the combined prices we see on all the major G8 pair combinations
the magic comes from then seperating and observing each currency (without the complication of multiple pair charts) in its natural habitat-and we watch how it interacts with other currencies under various scenarios and conditions
we make it much simpler to see the currency Trading oportunities in 3d colour whereas other systems wade through 1 dimensional pairchart scenaros.....
there is simply no contest.....and the 3d just got the miramax screen treatment :smart:
N
Last edited:
Similar threads
- Replies
- 0
- Views
- 4K