Best Thread Correlation Trading - Basic Ideas and Strategies

thanks mate !

I love ingot54.......and a lot of wise words in above...!

I have been putting the hammer down to get this thread moving (over calling somewhat) and my appreciation goes out to those still hanging with us and those who are and will be contributing...

I am also very concious of the tone of this thread but I think it is paying dividends as we continue to try to lighten up and simplify a dry subject......do not however confuse this brevity with a lack of respect or focus in making this stuff work...it will work and in a way that is relatively novel (dare I say) compared to most correlative techniques.

so - we learn it, we become masters of it and we trade profitably with it !

As we get more of a team online contributing and sharing ideas I will step back to (finally) crystallise the other ideas and related indicators I have regarding this subject (yes including plenty amassed in the last month!)....and I will get something out there available for keen followers in the next month or so....

I have never started a thread before anywhere...(14 posts in 5 years before this)...and I am learning as we go about everything to do with running this kind of thing...(nothing to do with the trading !) I am truly knackered today.....but tomorrow is another day and I believe we are going to create something special here......7,500 viewings on this thread cant be wrong !

so as Ingot54 says...lets mount up and kick some butt !

N
 
agreed.........

Hi Alan.....


I couldnt agree more........the corrie is basically a 3D Ma indicator that we need to understand and tame....it has same problems as standard Ma's !

so how do people who trade Ma systems make those work ?

N
 
Hi Neil & Ivan,

For my style of trading, the shorter tfs are more suitable. The 5 min suits me just fine.

I think it's possible using Corrie, combined with price action, to make some nice profitable trades. One of the keys may be not to get greedy and be content with 20 pips per trade. One of the hardest things to determine is whether a particular pair has reached it's maximum divergence and will then reverse positions. I'm not a fan of o/b-o/s indicators; they can be very misleading.

The risks, in using Corrie, as a stand alone, are apparent. Often, one pair will be above/below 0 together yet, the price difference between them has increased/
decreased quite considerably. The other difficulty is that Corrie 0 line divergence, frequently, doesn't occur until a price move is well underway and reaching exhaustion of the move.

My reason, for pointing out Corrie's weaknesses, is that I believe, if those weaknesses can be eliminated, then this is something that will prove to be a real asset in trading.
Hi Alan

I concur 100% with what you are saying. It is interesting that you enjoy and thrive on the 5 min TF, while I prefer the longer TF.

Perhaps this is why I continue to add-in the stochastic and the MTF ADX, which I call the Trend-Power Indicator. It allows you to see the strength of the trend on all TF simultaneously. Looking above / below the preferred TF will always give confidence. But as far as looking for that magic silver bullet ... it will always come back to the skill of the trader, in reading the price action and in using the chosen tools.

As I see this, the Corrie make the choice of which pairs to trade, a breeze. But it is far more than that ... it tells the trader the STRENGTH of the move, because of the position the move commences from, in relation to the zero line. The zero line is the "mean, give or take a little, and a move that crosses from above/below can be the beginning of a powerful burst away from the mean.

The Reversion to the Mean later, is where I think the best trades will be revealed. There are not so many of those, and I think we may be tilting at windmills trying to find a few of them each day. (Can happen of course).

But with experience (practice) and patience (being on the hunt) the good trades will come to us. There is nothing to force - indeed, while we are trying to "will" a trade to appear, the "natural" setups may be passing us by.

The use of other TF to understand the strength of the trend should not be underestimated - indeed it is almost accepted practice these days, for traders of all TF to check what the adjacent TF trend is doing.

Maybe your approach is right - "Pick 'em to win" (longer term) but "Play 'em to place" (take a bite out of the middle of the move - scalp).

Can we do this?

It would involve checking the Corrie on other TF, but I am certain this would pay handsomely. For example - my 4H trade above, could have yielded a guaranteed number of pips, had I perhaps chosen to take a 1H TF trade.

Will need to examine the action when I again have my charts open.

Thanks for the post Alan.
 
Hi Neil & Ivan,

I can't compete with your knowledge of Corrie, as I've only been getting to grips with it for the past 24 hours.

With a shorter tf in mind (5 & 15min), I've been changing EMA & Delta settings, like a man possessed. I like the 100 ema with delta 3 but, in all honesty, it's only made about a 5 min difference for entry points -v- 200 ema. However, on the 5 min tf, that 5 mins can mean 20+ pips.

We're familiar with chart patterns and we look for those patterns that, usually, result in profitable trades. I get the feeling that Corrie may produce patterns, that become readily identifiable, over time. It could be TL breaks, High/Lows and many more that I haven't even seen yet. I would be quite happy making 3-4 trades a day, producing an, almost guaranteed, 20 pips a time. That's meaningful money by the month end. I follow 8 pairs but, only trade 4, usually. Those with the smallest spread. Corrie could make trading wider spread pairs worthwhile, if her patterns can be read like a book, at some stage.
 
Last edited:
the Corrie and TF variables

Hi Alan

Experimentation is the key to this indicator and believe me we are in somewhat
virgin territory here.........there are similar tools out there but mainly they
appear to produce simple trend or strength levels for each currency (sometimes in isolation) and certainly without the aggressive combat we see on the corrie (yes it can look like a barbrawl sometimes on the charts!)

Have a read through my early posts.....lower MA's produce more agressive movements of the currencies (as you would expect) and distort the trending lines somewhat.

higher Deltas soften the spiky appearence of the movements and will flatten the trend lines (as you are probably finding)....I prefer 200/1 as it is almost real time and does not distort the trending lines much.

we are and will find sucessful patterns here but its all new and needs to reveal itself to us with practice........

I have also mentioned in earlier posts that 2-3 TF's can be used to yield opportunites (as in normal Chart strategies)....temporary fall backs in a higher TF main trend await the signal from a lower TF where trend commences again in line with the HTF to trigger a trade..

I suspect we will be able to add so much Science to the equation and then it could be just experience and chart watching where eventually a sixth sense takes over somewhat...I am not kidding when I state that achieving "master" status will take time and effort to understand and interpret this tool...but it should be worth it in the long term !

N
 
Last edited:
Hi Neil,

I read every post, before taking the plunge.

I'll change to 200/1, although, I seem to recall that your recommendation, for the 5 min, was 200/3. Perhaps, I missed a bit (senior moment)!!

Obviously, what we musn't be tempted to do is to over tune the settings otherwise, we end up with a a page resembling coloured spaghetti that's been, temporarily, hit by a blender. I have all my pairs set on 5mins but, look at the longer tfs when I boot up in the morning. However, a day of chop on the 1 hr can mean a few, nice hit and run trades on the 5min. That's just my preference. I've traded off the longer tfs but, prefer the smaller stop levels that the 5 min can offer.

Apologies for an error in an earlier post, when I said that Alpari don't offer NZD. They do but, only against AUD. It's easy to get carried away with all the pairs offered by some brokers but, the spreads can be huge and, imho, virtually untradeable.

It's good to see the kind of discussion we are having here - I see only progress with such an open attitude, and I enjoy being a part of it. Reminds me of a quote:

"Hell, there are NO rules here ... We're trying to accomplish something." Thomas A Edison

A good thing about the Corrie, is that you do not have to remain glued to one currency pair ... or keep flicking through charts. It is only necessary to have a glance at the Corrie and when your eyes are trained (which takes about a day) you can quickly pick out the pair that has the highest potential for a large move. You have the option to sit it out because of spread, or other obstacle, or to do a quick raiding scalp trade - get-in-get-out!

It's exciting for me because of my difficulties with support and resistance in the past - with this method you are just about swept along in the trade on entry. You need to rely less on pull-backs, and pivots etc than you would in conventional trading, though that remains to be proven. I think that if we still are able to identify key support/resistance levels, we would be looking at a very distinct edge indeed.

As for me - I will hang on to my beloved stochastic, and trade with renewed confidence when there is confluence.

Let's get 'em!
 

Attachments

  • roy_trigger.jpg
    roy_trigger.jpg
    28.4 KB · Views: 212
Thanks Guys !

Hey Guys

The thread is truly opening up nicely and I now have 2 great contributors who are willing to be open minded as we build the team and the ideas.....

I love the Cowboy comments........kinda reminds me about 20mins into the Magnificent 7 when Yul and Steve get their third partner....(I cant remember who was third...?)

errrr.....I would like more than seven contributing eventually please ! :cheesy:

Real busy today re deadlines but will try to nip in later....

N
 

Attachments

  • themag7.jpg
    themag7.jpg
    98.3 KB · Views: 224
Hi Neil,

I read every post, before taking the plunge.

I'll change to 200/1, although, I seem to recall that your recommendation, for the 5 min, was 200/3. Perhaps, I missed a bit (senior moment)!!

Obviously, what we musn't be tempted to do is to over tune the settings otherwise, we end up with a a page resembling coloured spaghetti that's been, temporarily, hit by a blender. I have all my pairs set on 5mins but, look at the longer tfs when I boot up in the morning. However, a day of chop on the 1 hr can mean a few, nice hit and run trades on the 5min. That's just my preference. I've traded off the longer tfs but, prefer the smaller stop levels that the 5 min can offer.

Apologies for an error in an earlier post, when I said that Alpari don't offer NZD. They do but, only against AUD. It's easy to get carried away with all the pairs offered by some brokers but, the spreads can be huge and, imho, virtually untradeable.


Hi Alan.........start slow on the 200's (I used to play with 3-500 !) and then lets speed it up when we have more experience...the faster MA distorts a lot of things re rate of price change between Currencies so if 2 currencies are running parralel but at different heights on the Chart (espec one above and one Below the Zero) then the top 1 is still accmulating value against the bottom (rate of positivechange is higher on the top one)

200+ does not really reflect this so nicer to train on......200/1 is virtually watching real time bar price changes , Delta 3 is like watching a 3ma instead of a 1 ma reducing the twitch)....I like 13 to get more summeric market trending/commentaries as this is Low enough to distinguish movement but high enough to remove the noise

confession - I am drip-feeding this Thread a little as we go :eek: (as I do not want
to dictate contributors own thoughts/ideas on the corrie)

one method I use actually overlays 2 corries on top of one another to add more MA's

so - when you want a headache........run 1 at say 200/1 and one at 200/3...use the crossovers to trade the prevailing breakouts !

suggest you drop to 4-5 lines max as it becomes busy ..also you will need to keep adjusting the screen to align the Zero lines.....:(


ok time to go to work!
N
 
Last edited:
Make this a proper correlation thread !

sorry ..just been told to make this a proper correlation thread so we must all post things like this now :whistling

No offence intended to this excellent publication.....(y)

DailyFX.com
Forex Correlations (August): Dollar, Swiss Franc and Japanese Yen's Role as Safe Havens Shifting
MONDAY, 03 AUGUST 2009 23:32:57 GMT

Over the past month, we have seen a sharp revival of risk appetite; but the market’s preference for safe haven versus those with potential for speculative appreciation have changed dramatically.
The following is our monthly correlations update for August. As we have stated time and again, correlations between different currency pairs will inevitably shift over time. Therefore, it is of utmost importance to keep abreast of these fluctuating relationships to fully understand your trades and portfolio.
In order to be an effective trader, it is important to understand how different currency pairs move in relation to each other. There are a few reasons why this is significant, but most importantly, it allows traders to understand their exposure. For example, having a portfolio that consists of the USDCHF and EURUSD is different than having a portfolio comprised of USDCHF and USDJPY. Over the past month, we have seen a sharp revival of risk appetite; but the market’s preference for safe haven versus those with potential for speculative appreciation have changed dramatically. In this period, a currency that was often hailed as one of the two three carry currencies – the Swiss franc – has seen considerable deviation from the normal path of risk appetite that has been carried by the Japanese yen alone. Through the third of these low yield currencies in – the US dollar – and the correlations (or lack thereof) are laid bare. In the past month, we have seen the trouble in the Swiss banking sector and SNB intervention break the franc’s rudder as the low risk currency in the USDCHF pair and leave the correlation between the two near zero (0.00). In the absence of risk appetite and aversion, franc traders are drawn to the health of the small economy which is heavily influenced by the health of its primary trade partner – the Euro Zone. In the past month, the correlation between EURUSD and USDCHF has soared to near lock-step levels (-0.96). Clearly, having a long position in EURUSD and USDCHF at the same time would have the general effect of one cancelling the other out. Of course, these two currencies may have different pip values and the correlation is not perfect, so the P/L will not be exactly zero. Falling into the middle ground, the returns of a long USDCHF and USDJPY position would in essence reflect two totally independent positions (though don’t expect this free-floating relationship to last forever).
Furthermore, we can tell from our tables correlations rise and fall through different periods. Monitoring the changes in these relationships, further clarifies the underlying changes in risk appetite and those currencies that are at the extremes of the speculator’s spectrum. Juxtaposing a currency that was once held a safe haven currency, but that is now holds a very different influence against its US counterpart; USDCHF has seen its relationship with AUDUSD tighten with time. Over the past year, AUDUSD would take the opposite path to USDCHF only 34 percent of the time (-0.34). However, just over the past month, these high risk currency pair (AUDUSD) and former safe haven leader (USDCHF) has seen a far more consistent pace amongst each other. Overall, having this knowledge will allow traders to effectively diversify and manage their portfolios over time.
Regardless of your trading strategy and whether you are looking to diversify your positions or find alternate pairs to leverage your view, it is very important to keep in mind the correlation between various currency pairs and their shifting trends.

:sleep::sleep::sleep:

OR you could throw up a 4hr corrie on a 200/3 and it will tell you everything you need to know
for the 8 major currencies over the past few months !

N
 
Last edited:
A "Proper" Correlation Thread?

sorry ..just been told to make this a proper correlation thread so we must all post things like this now :whistling

No offence intended to this excellent publication.....(y)

DailyFX.com
Forex Correlations (August): Dollar, Swiss Franc and Japanese Yen's Role as Safe Havens Shifting
MONDAY, 03 AUGUST 2009 23:32:57 GMT

:sleep::sleep::sleep:

OR you could throw up a 4hr corrie on a 200/3 and it will tell you everything you need to know
for the 8 major currencies over the past few months !

N
Mmmm ... not sure where that came from Neil ...

Did someone say we have to only discuss "proper" correlation issues here?

I thought that's what we are doing!

But I am pleased to read anything on correlation - whether it is on the longer term TF over weeks and months (which is what the August articule from the Daily FX.com seems to be saying) or whether it is on the TF we are interested in here.

Anyway mate - for me nothing will change ... I will still approach this form of trading as "Correlation Trading" (unless I am forced to call it something else).

A rose by any other name ... would smell the same!
 

Attachments

  • Rose.jpg
    Rose.jpg
    55.1 KB · Views: 191
Proper correlation trading !!!??

Hi Ivan

no ones telling us what to do.......(yet).......just saw that quote and reminded me how we are trying to help change this stuff into the new rock' n'roll ! :clap:

hows the "call" going from yesterday ? :?:

N

ps......give us a song !!!!!
 
Last edited:
todays action.....calling all 5 year olds !!

over to you all.....(dont be shy)

what do you see ?.......and no one say a mess :LOL:

N
 

Attachments

  • FXC11sep5min1hrchr1.jpg
    FXC11sep5min1hrchr1.jpg
    99.4 KB · Views: 284
Last edited:
tell you what I see..........

......as Alan has mentioned in last few posts re using more TF's


I see GBP (red) way above Yen (and USD green) on 1 hour

But the opposite situation ( well GBP Yen mainly) on the 5mins.......

hmmmm:sneaky:

N
 
Current trades ...

Hi Ivan

no ones telling us what to do.......(yet).......just saw that quote and reminded me how we are trying to help change this stuff into the new rock' n'roll ! :clap:

hows the "call" going from yesterday ? :?:

N

ps......give us a song !!!!!

Lol ...

Not sure about a song Neil ... would have to be about "roses"!

YouTube - Sandy Scott - Wallpaper Roses

But last night's trade is still live ... and consolidating. You remember that was the EURAUD. I'll post the chart of the update - I have checked the TF around it, and the AUD is still looking weak.

Meanwhile there is a hot opportunity to grab 60 pips right npw with the GBPAUD - pulling back on the 1H and 30 min, but looking strong on the 4H and Daily.
 

Attachments

  • GBPAUD.GIF
    GBPAUD.GIF
    67.3 KB · Views: 247
  • EURAUD.GIF
    EURAUD.GIF
    62.3 KB · Views: 243
Loving this !!!!!

welcome to
SINGALONGATRADE ! :party:

N

hmmm trade looks interesting...love what you are doing wth the charts mate
 
What is to be seen ...

......as Alan has mentioned in last few posts re using more TF's


I see GBP (red) way above Yen (and USD green) on 1 hour

But the opposite situation ( well GBP Yen mainly) on the 5mins.......

hmmmm:sneaky:

N

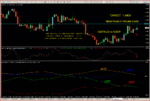
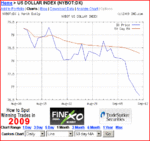
It's a great way to view the Corrie Neil - the 5 min and 1H - you certainly can grab pips by comparing the two. The USD Index has fallen off the table - see chart below - so no wonder it is wearing the dunces cap
 

Attachments

  • Correlator.GIF
    Correlator.GIF
    15.9 KB · Views: 245
  • USD_Index.GIF
    USD_Index.GIF
    16.6 KB · Views: 285
Last edited:
Corrie Comparisons

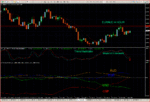
I have put up the Corrie on 5min -15min -1H - 4H time frames for comparison.

You'd have to agree this is not only a great way to get the gist of the moves, it is essential if thinking about a scalp.

If you want to scalp, you need to know that if you stuff it, the trend is still in your favour, and will dig you out of the hole when it snaps back into line with the higher TF.

This won't always happen - all trends begin with the tick. But until it does change, the trend is your friend!
 

Attachments

  • Correlator_1.GIF
    Correlator_1.GIF
    19.1 KB · Views: 240
  • Correlator_2.GIF
    Correlator_2.GIF
    21.6 KB · Views: 245
  • Correlator_3.GIF
    Correlator_3.GIF
    16.3 KB · Views: 238
  • Correlator.GIF
    Correlator.GIF
    15.9 KB · Views: 254
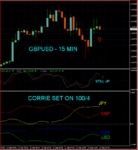
Nice GBPUSD set-up ... be careful though

I am posting this GBPUSD chart showing the diversion between the GBP and the USD.

On the 1 H (not shown) there is a nice hammer candle (one candle back) and this is a price signal for a strong rally.

I post this as an opportunity for you.

Best wishes

Ivan
 

Attachments

  • GBPUSD.GIF
    GBPUSD.GIF
    34.4 KB · Views: 251
Ivan............youre on fire !!!!

I said he rocked !!! (y)

N
 
Top