Best Thread Correlation Trading - Basic Ideas and Strategies

Hi N and all the silent ones,

Late posting today because of an unusual (for me) delayed exit on one trade.

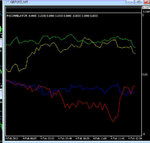
GU; 21 pip loss. second trade 71 pip profit.

EU; First trade 23 pip profit. Tempted to try a second long on 11:40 bar but didnt feel enough time as usual cut off fast approaching.

EG; Tried a short trade stopped out for 16 pip loss a few bars later.
second trade 12 pip profit.

We are getting close to the infamous nfp day so watch out for lots of sideway slithers - trade well and regards,
Simon.

Hi mate..........looks to me like 85 not out and rain stopped play.....shame about that E/G play as you would have been toasting a great century in clubhouse at lunch !

(listen to me....mr trader:whistling)
N
 
Last edited:
fomats.gif


Mind if I play? :)
 
fomats.gif


Mind if I play? :)

Hi TRO

welcome to our humble thread (y)........please feel free to join in but please keep the bells and whistles to a minimum as we are but simple folk here :whistling

looks like a nice indicator for the Euro/Swissie Convergence plays ?

N
 
Last edited:
Hi TRO

welcome to our humble thread (y)........please feel free to join in but please keep the bells and whistles to a minimum as we are but simple folk here :whistling

looks like a nice indicator for the Euro/Swissie Convergence plays ?

N

"bells and whistles"?

What are you talking about?

This is simple stuff. A couple of gauges that tell me what's going on.
 
"bells and whistles"?

What are you talking about?

This is simple stuff. A couple of gauges that tell me what's going on.

Hi TRO

exactly....i've seen some of your work and indicators / dashboards .....they are mind blowing !

anything new on the correlation front re indicators ?.....as you know the FXcorrelator I use here is a hybrid of the strengthmeter work you did many moons ago

N
 
Nice to know where you're at, TRO.

I'm very happy for you ... :clap:

And your point in posting?

Just to show off that monstrous piece of collage?

NVP asked "anything new on the correlation front re indicators ?"

So I answered.

Are you trying to start something up with me?
 
NVP asked "anything new on the correlation front re indicators ?"

So I answered.

Are you trying to start something up with me?

Not at all, TRO - a very warm welcome to the thread.
May you learn a lot here, and share even more as generously as your fore-runners have all done.

Now, I am eagerly awaiting the explanation of what looks like an overgrown chart of the EURUSD with a half dozen indicators, a window with a Currency Strength Indicator, all accompanied by a serious lack of explanation.

Thus my comment - what th' !

My post was a tongue-in-cheek dig, to encourage you to humbly explain what the dickens it all means.

I am hoping there is a simple reason for using the other indicators with the Currency Strength Indicator, and that your explanation will be enlightening enough to be of some use to readers of this thread. Readers, who have, by the way, persevered with the thread for 5 months now, and endured truck-loads of testing and research and experimentation, to the point of exhaustion.

Speed on, sir, speed on with your explanation of your interesting chart.

To begin with -
NVP asked "anything new on the correlation front re indicators ?"
Could you explain how your chart is "new" and how it relates to correlation.

Let's hear it.

Here's one of mine - similarly baffling at first, but then boringly obvious as you quickly see the old suspect indicators.
 

Attachments

  • nzdusd_1hr.gif
    nzdusd_1hr.gif
    42.7 KB · Views: 148
morning all..............:sleep:

long day today so starting early......flat overnight......Nikkei and Dow was in fact a little bullish.....gold ranged

watch the breaches of the overnights and the 7am 15m bar.....

N
 

Attachments

  • 4th feb.jpg
    4th feb.jpg
    145.3 KB · Views: 97
overview

heres the 4h corrie on 1000/1

what a bunfight on the top floor ! :cry:

at least we all know whos not in fashion........the eurogang are not flavour of the month.....well swissie is just being swissie really :whistling

lets look at the markets next

N
 

Attachments

  • 4h bunfight.jpg
    4h bunfight.jpg
    170.1 KB · Views: 130
heres the markets vs tag team......

rot set in mid jan really with all markets falling......Tag stepped up to the plate and its been a great ride so far to end of jan.....markets fighting back a little in Feb though......but is that the start of a the fall again I now see ?

N
 

Attachments

  • the markets.jpg
    the markets.jpg
    89.8 KB · Views: 114
fjp1th.gif


Brings back memories...

Hey TRO......

have you ever considered trying to change a strength-meter into a candlestick format ?

I use the 1000/1 a lot here and the lines are ok for S/R levels and simple price action......but boy if it was all in candlestick format that would open up many more price action analysis/opportunities ...sure it would be a busy indicator in G8 format but we generally remove a lot of the crrencies anyway......in effect a price index !

respect (y)
N
 
Gold verses usd

Hi all

you are all no doubt bored by the fact that we preach the correlation power laws here and that one of the main ones is that :-

"thou shalt observe the negative correlation of USD to GOLD"

if not go back to the start of the thread....do not pass go ...do not collect $200 :p

heres Jack crooks take on things and boy does he see USD continuing to climb this year.....so dont pump money into GOLD !

I still like the idea of playing with gold using non USD currencies though.....hmmm:sneaky:

N
 

Attachments

  • gold vs USD.pdf
    838.6 KB · Views: 342
more gold talk......

hmmmm
i'm not going to debate here how Gold correlates with the equity or other markets....read some of Jacks work and subscribe to his updates if you want to get into the esoterics of this kinda stuff...........

One thing I do know though is that I stick to my guns and focus on this USD/GOLD inverse correlation - look at below

in early december gold started a long walk south and the markets held including oil (brown).......gold fall is a screaming indication for USD to rise ....and it did (y) marching straight up though the Yen that fell ! (note that the markets were flattish which did not give Yen impetus in either direction and certainly not the push to rise with USD)

now everything is pretty correlated again (markets vs gold and Yen vs USD) .....but as I say always respect the USD /Gold relationship....regardless of what other things are doing.....we'll worry about Yens relationship withthe markets if we ever decide to trade it.....(and there are possibilities there :sneaky:)

N
 

Attachments

  • gold verses USD .jpg
    gold verses USD .jpg
    99.5 KB · Views: 122
the downunder twins are not buckling much re the tag assault today (unlike others)

if the tag falters they should then push further upwards.....

N
 

Attachments

  • aussie pair.jpg
    aussie pair.jpg
    50.2 KB · Views: 125
let me get this straight ......a 0.1% fudged GDP figure encourages the goverment to announce an end to formalised QA.......and thats all good news for sterling eh ?

are goverment officials all trying to buy their holiday dollars today then ?

better get in quick......

N
 

Attachments

  • fake gbp move.jpg
    fake gbp move.jpg
    31.1 KB · Views: 134
2k4zex.gif


Ingot54:

You wanted an explanation to my chart? Then you should have asked a specific question instead of posting what looked like the start of a fight.

You will notice 2 lists of pairs on the right hand side consisting of all the pairs that have the base currency of the pair on the chart and all the pairs that have the quote currency. Remember, we are trading currency PAIRS! The arrows show if those pairs are moving up or down.

The subchart plot gauge shows the currencies in ranked order, direction of movement, and informational messages.

Simple concept really.
 
Hi N and other viewers,

As commented yesterday, bit of caution needed today in respect of the big one tomorrow, so did I read that?!!

GU; Waited to see if 08:05 bar gave me a signal by closing on or below 58684 but it didnt and instead moved up weakly and started to decline again.so set sell stop at required trigger value and was filled during 08:30 bar. Price did its usual by going down a little then bouncing up again to print lower high, then drifted down and 09:25 bar ignited a brief spurt of momentum in my favour before drifting up once more with no conviction, then dropping further down. Tightened TS after 10:05 bar drop and got taken out during 10:25 bar for 19 pip profit. Second trade placed sell stop at 58422 and filled by 10:55 bar, price did a very weak retrace for a few bars then popped downwards nicely and as clock ticking against me, I ran tight TS after 11:35 bar which got taken out by weird looking 11:55 bar for 15 pip profit.

EU; Very thin price action today. First trade went short on opening 08:05 bar at 38504, price moved up slightly then flopped over with a small bar range until 09:00 bar push down and I followed this with TS which got hit during 09:20 bar for 11 pip profit. Watched price try to march back up the hill without hitting two sell stop triggers until it found a local high around 10:30 to 11:00 bar range, moved sell stop up to 38418 and 11:20 bar filled this for second trade. Price wandered up slightly with no momentum at all so I closed trade at 11:55 bar for 4 pip loss.

EG; Absolute basket case here today, chart all over the place so left well alone.

Very hesitant morning as obviously markets gearing themselves up for a volatile run into tomorow's key data release - be careful when trading this afternoon, personally I'm just going to simply switch off charts for the day!

Trade well and regards,
Simon.
 

Attachments

  • gu040210.gif
    gu040210.gif
    14.9 KB · Views: 135
  • eu040210.gif
    eu040210.gif
    16.1 KB · Views: 118
Top