Comprehensive Trading System/Methodology

Hi bbmac,

Thanks for telling me about your thread.

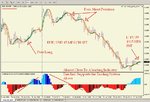
I trade divergences where price double bounces off 4hr/daily/weekly/monthly s/r levels, on a 1 min chart.

Use a tight stop, normally 5 pips and take profit of 5 or 10 pips usually.

I use OSMA / MACD & Stochastic divergence indicators, if they line up and the stochastic is overbought/sold I take the trade.

What do you think of this strategy?

Alf


The basic premise of the strategy seems sound, ie oscillator divergence with longer settings o/b o/s levels @ potential supp/res levels, and if it works for you, ....keep going. My further coments are below but I caution you not to stop doing something if it already works.

a. A double bounce is good.

b. A 4hr+ 's/r level' (as you call it) can be quite wide if you determine them in a similar way to me [see post 74, page 10, the Part I doc to compare notes] and I therefore wonder whether you might scale in even further to the 1hr chart potential 's/r levels 'and also look for confluence of other potential supp/res factors

c. Determining a trigger and intermediate and trend t/f can help you also trade in a similar way but 'with trend' direction so that you may be able to increase your average win ratio.

d. I find certain patterns of divergence/extreme osc readings work better than others, ...see part I doc mentioned above for details.

G/L
 
Last edited:
Prep before start of new trading week

Prior to the start of the new trading week the screesnhot shows the 1hr obvious previous swing hi/lo extremes. (Although 30min is my preferred trend t/f, I use the 1hr as it's proxy just in respect of the prev sw hi/lo's as the basis of potential supp/res/sbr/rbs)

Key:
green narrow dotted = previous swing lo=previous support
green wide/narrow dotted = minor previous swing lo= minor previous support
white narrow dotted = previous swing hi & lo
red narrow dotted = previous swing hi = previous resistance
red wide/narrow dotted = previous minor swing hi = previous minor resistance.


When price approaches a previous swing hi/lo zone, I mark the other extreme of the potential supp/res/sbr/rbs zone with the crosshair tool, and of course I have noted what other potential supp/res factors (if any) such as fibs, bids/offers etc are co-existent in any of the potential zones that fall within the average daily pip range.

As far as the 5min (intermediate) t/f is concerned I tend to just visualise the zones with the crosshair on the main 5min chart, making a mental/post-it note as needed of any other potential supp/res factor that fall in the most immediate zone (s)

This trend t/f previous obvious swing hi/lo zones chart may have to be updated at the start of the trading session tomorrow (Monday) depending on what happens in the overnight/asian session.

aovsrq.gif
 
re: Previous Price Swing Hi/Lo zones (Price Pivots)

Useful to remember the general observations re price action around them;

a. The more immediate/recent obvious previous price swings tend to excercise the most influence over price lest there be a really obvious previous swing in the recent past that caused a big reaction/was tested a few times

b. Price tends to test nearer to the deepest extreme of the zone lest there be obvious confluence of other potential supp/res factors elsewhere within the zone.

G/L.
 
Re-entries (to trend) and Reversals (against trend)

Mon 19th Jan 2009, Gbpusd.

Price sells off after an opening gap up from friday's close and an asian session hi @ 4906.

The 1hr chart below shows the potential rbs and potential sbr zones, with the red and green circles showing the previous swing hi/lo's and the horizontal lines marking the zones that were in play this London/European morning session so far.
2v34ly8.gif


Set-ups presented themselves @ points a, b, and c (all cirled in white.

@ Point a that previous swing hi=previous resistance=potential rbs, a 1min trigger Reversal type C with supporting 5min Reversal extreme set-up shown below...screenshots below;

1min trigger Rev C set-up
14llen9.gif

Supporting 5min Rev Extr set-up
1zgqkw1.gif


5min in a downtrend now as a 3rd LH is made off the asian hi, a 1min Re-entry type 2 set-up presenting itself at the LH and 5min previous swing lo=prev supp=potential sbr shown in screenshot below;
24zmb11.gif

With the 1min Re-ent 2ry type 2 set-up;
8xnhah.gif


This 5min prev sw lo zone coincided with a 1hr previous minor swing lo shown as point b in 1hr screenshot at top of this post. it could be argued that a 5min Re-entry type 3 also supported the 1min Re-entry type 2 set-up shown above;

5min Re-entry type 3
24o3h9j.gif

It is uncommon to have a 1min Re-entry set-up supported by a 5min Re-entry set-up but not unseen..as the 5min potential sbr coincided with the minor 1hr previous swing lo=potential sbr.

Price continues to sell off from the potential sbr zones and set-ups shown above to reach the extreme of the previous 1hr swing hi zone @ point c at which point a 1min trigger Reversal extreme (could also call it a Reversal A seq) supported by a 5min Reversal type C set-up to give another hi-probability trading opportunity;

1min Rev Extr
2h5iij7.gif


With supporting 5min Reversal type C
14w35w3.gif


So 3 hi-probaility set-ups with clear individual price action trigger @ pre-identified potential supp/res/sbr/rbs as a downtrend develops.

Pre-trading session and intra-trading session Prepartaion is more likely to result in gain than not over any sample of hi-probability trading opportuunities that occur.
 
Last edited:
Trend t/f today

The screenshot below shows the 30min trend t/f and as you can see quite a rangy chart up until 2 x LH's and a LL now off the asian session H.

33yhuva.gif


With 5min [intermediate t/f ] already in a downtrend.

Keep up to speed with the chart conditions (per overall price action analysis-classic peak/valley analysis) on both the intermediate and trend time frames to enable you to make the miost informed trading decsions.
 
Last edited:
More hi-probability set-ups

You can see the 1min Reversal extreme set-up below (it was supported by a 5min Rev A seq set-up as you will see from a look at the 5min main chart.) The 1min trigger and supporting 5min main chart set-ups appeared at the previous 1hr swing lo =potential supp zone shown below the 1min trigger set-up, below, and enjoyed small charts supporting conditions too.

Note too on that 1min chart screenshot the 1min Re-entry type 4 set-up too, after the pullback/retrace. Both set-ups produced attractive pip gains with the Re-entry to trend see-ing a with trend follow thru to new lows.

ej777.gif


The 1min set-ups are here;

5z1u7s.gif
 
BB,thumbs up for good work(y)
Must say that i have not read whole tread or checked rules and tools of method that you are using...Think it is variation of Elders TS.
One thing that have caught mine eye is that you are using quite lot of indicators.
I must say that i admire your ability to menage through this bunch of indicators on M1:)
When i have Fibo retracement along with few S/R lines on chart i get dizzy!:LOL:
Do not think that i am criticizing you.I am just passing by and saying hello!
VTK
 
I have to agree with you ving. bbmac has a pretty goody trading method but all of those indicators are a bit mind boggling. :cry:

I tend to lean towards simplicity. I am checking out a little mechanical trading system that has 2 indidcators.
  1. The Trigger Indicator. The "Trigger-Lines"
  2. An MA that someone thought up that almost leads the trading signal.

Here's a picture of the system with a coupe of explanations.

It is simple but quite effective. :rolleyes:

I'm making a video for my blog. I don't know if A FLASH video is allowed here but when I get it finished I'll post a link to it.

Good trading to all
RT... :clover:

Anyhow, I thnk simple is a whole lot better.
 

Attachments

  • eur-15-system-forum.jpg
    eur-15-system-forum.jpg
    106 KB · Views: 253
I have to agree with you ving. bbmac has a pretty goody trading method but all of those indicators are a bit mind boggling. :cry:

I tend to lean towards simplicity. I am checking out a little mechanical trading system that has 2 indidcators.
  1. The Trigger Indicator. The "Trigger-Lines"
  2. An MA that someone thought up that almost leads the trading signal.

Here's a picture of the system with a coupe of explanations.

It is simple but quite effective. :rolleyes:

I'm making a video for my blog. I don't know if A FLASH video is allowed here but when I get it finished I'll post a link to it.

Good trading to all
RT... :clover:

Anyhow, I thnk simple is a whole lot better.

Me too, but I would add some S/R Levels as well.

Cheers

Alf Ralf - My FREE Chat/Trade Room is
online
 
Response to above posts

Hi and thanks for visiting the thread and leaving some comments.

Indeed this methodology is a derivative of Elder's triple screen approach in that it analyses price across 3 time frames, but unlike Elder [who works on the longer time frames and looks for set-ups on his intermediate t/f in direction of his higher t/f trend, with entry fine tuned on his lower trigger t/f,] ...this system/methodology looks to identify set-ups on the trigger time frame - either with or against the trend on the intermediate t/f + with supporting intermediate t/f (+) set-ups where applicable.

Essentially it is based around identification of potential support/resistance, and price action, (both overall price action for trend, and individual price action as the trigger for entry.)

On the sub 1hr t/f's that I choose to operate on, I use indicators that develop repeating patterns of band deviation/oscillator divergence or extremes that indicate a hi-probability trading opportunity when acted upon in the right overall price action circumstances. These indicator based set-ups/patterns stem from a prolonged realtime acute observation of their behaviour in certain price action conditions. It is the particular combination of these oscillators with these bollinger bands and supp/res channels that give rise to the particular repeating set-ups/patterns.

(Using a 1min trigger can be unreliable if relying on price action alone, so the repeating patterns/set-ups that the indicators form are a hugely beneficial tool in aiming to pinpoint the optimum market entry. I accept though that if working on higher time frames, price action alone can be a sufficiently high probability trigger in the right overall price action circumstances.)

For anyone considering using the repeating indicator set-ups/patterns, you've got to see beyond the indicators and see the repeating set-up/pattern.

I wouldn't advise plotting fibs or previous price swing hi/lo's on any of the main chart templates, this indeed would make the charts unwieldy and difficult to make out. Personally I dedicate 2 separate screens to the identification of potential support/resistance/sbr/rbs one being for the fibs, one being for the previous obvious price swing hi/lo's (price pivots.)

The system/methodology accurately reads the repeatable nuances of price action and by identifying overall price action conditions and potential supp/res/sbr/rbs on both the trend and intermediate time frames it afford the user the earliest possible re-entries to trend after a pullback and the opportunity to profit in ranging markets/trade against prevailing trend.

In so doing the confluence of the repeating indicator set-ups/patterns @ pre-identified potential supp/res/sbr/rbs with an individual price action trigger when overall price action conditions (trend or range/consolidation) are optimum for the set-up/pattern results in very high probability trading opportunities that in turn results in a very high strike rate (winning trades as a % of total trades) over any sample of set-ups.

I commend this system/methodology to anyone.
 
Last edited:
Interesting point on Mthly Chart

Always interesting to look at the longerr time frames as cable makes new lows with this month's candle so far (not formed yet of course) being the 7th consecutive bearish candle. Screenshot below shows price is in the previous swing lo zone=potential support on the monthly chart.

106ybmw.gif

A Reversal Extreme developing on this Mthly Chart? ...Could be...
ogclt4.gif


Look at the Weekly, a Reversal type B developing at this mthly potential support zone? again could be...not formed yet.

Interesting/sometimes useful to look at the longer time frames to try and guauge a bias for direction in the forthcoming sessions which might help with own time frame analysis.

G/L
 
Strong selling down during Asian then London/European morning sessions so far resulting in a 500pip+ hi-lo pip range so far (that falling outside of current 5, 10 and 20day averages) by the time cable found some interim support in that monthly pot supp zone, retracing back up to 23.6% of the 4347-current intraday lows 3933 move...the 5min Re-entry set-up developing there, timed as a 1min Reversal type C. (currently over 70pips in the black, but yet to see a with trend follow thru to new intraday low)

The 5min re-entry [to trend] type 4 set-up is shown below;
2mxh99i.gif


EDIT 1152am gmt: Wih trend follow thru off the set-up just saw a new LL ie a New Intraday low .
 
Last edited:
A 'perfect storm' at current intraday lows

Gbpusd Price sold off that Re-entry to trend (after pullback) set-up outlined above to see a new LL and intraday low deeper in the Mthly potential support zone also discussed in posts above. At the current intraday lows of 3860 price was well over 550pips down from it's intraday hi, like yesterday well outside it's 5,10 and 20day average pip ranges.

Mni had touted bids in the 3850region and at this area a 'Perfect Storm' of set-ups across the ascending time frames supported the 1min Rev Extr ii set-up. By way of example the supporting 5min Rev A and 30min Rev B are shown below, the 15min being a Rev C.

A confluence of set-ups in the ascending t/f's supporting the trigger t/f set-up at potential pre-identified support, particularly when price is well outside it's average pip range (s) is a high probability trading opprotunity, even against the trend.

supporting 5min Rev A
2mmcoi1.gif


supporting 15min Rev C

243120k.gif

further supporting 30min Rev B
311utfl.gif
 
Last edited:
Use of indicators

This subject has been oft discussed in this forum and others. I often see threads/posts stating categorically and absolutely that indicators don't work or that they are useless and the only way to trade is this way or that way. Of course what the authors of these posts really mean, is that they don't use them because;

a. They don't understand what the indicators are telling them -or- b. They haven't found a way of using them to the benefit of their own trading, -and/or- c. They have had a bad experience with them.

....in other words they are falsely projecting their own experiences across the universal subject of indicators.

There are so many ways to trade, so many edges,...so many tools, and none are more 'right' or 'wrong' than the others if they work for the individual.

In using indicators ask the following;

i. Do you really understand what they are telling you about price ?
ii. Do they tell you anything about price that price alone cannot ?

and then

iii. Do they add value/inform your trading decisions?

Answer those questions about any tools you use in your trading, and if all 3 answers are affirmative, then you have a useful tool.

G/L
 
Last edited:
Quadruple regular immediate [seperate valley] bullish divergence.

The 0842am gmt 1min Reversal type Aii exhibited a rare phenomenon, - effective Quadruple regular immediate [seperate valley] bullish divergence in the Osma....see screenshots below.

Regual double or even triple is less uncommon..and these divergence patterns at potential supp/res/sbr/rbs can be hi-probability in nature.

29m3dj8.gif


The divergence pattern in the set-up detailed above is shown here:
2ekhrio.gif
 
Re-entry to trend set-ups @ non- optimum places

I have some time to outline an example of an important price action phenomenon, as in a trade and holding.

...Downtrend continues in Gbpusd and finds support at bids/Dly S1 area 3712....pulls back to a LH, then H then HH on the 5min (intermediate t/f) chart...see below

qn0b43.gif


At the LH, a Re-entry type 4 on this 5min intermediate chart there was no min trigger set-up and no obvious potential sbr.
At the H, a Re-entry type 1 there was a 1min Rev Aii seq set-up trigger @ potential sbr the prev 1hr swing lo zone shown in screenshot below
At the HH , a Re-entry type 2, there was a 1min trigger, the Rev A seq @ potential sbr=the previous 1hr swing lo zone witgh 50% fib of the intraday move.

The 1hr potential sbr zone is shown below;
34q21vp.gif


In all cases the 30min trend t/f was trending down and all Re-entry set-ups discussed above came at an immediate LH on that trend t/f into whose trend a re-entry was sought...this is good
In all cases the macd histograms on the next 2 t/f's up from the re-entry set-up on 5min(ie 30min and 1hr) were below the axis...again conducive to a re-entry set-up.

Only at the First Re-entry type 4 did the 5min intermediate chart exhibit a Re-entry set-up @ an immediate LH, the subsequent Re-entry set-ups coming at a H then HH on that intermediate t/f although the price was still at an immediate LH in the downtrend on the trend t/f.

Not surprising then that the Re-ent 1 @ the H went on to see +30pips gain only before revesing higher @ a HL -as the optimum conditions of the set-up of coming at an immediate LH on both the t/f it sets-up on and the next higher into whose trend a re-entry is attempted, were not met.

Interesting too that the Re-entry @ the HH on the 5min....came at the very deepest extreme of the potential sbr zone on the 1hr with the 50% fib confluence...(see previous points re potential supp/res/sbr/rbs zones.) This set-up has seen +40+ pips, but I wouldn't be surprised to see this reverse higher too,...time will tell, anything can happen.

EDIT 1102am gmt...this Re-entry type 2 is now down over 130pips from the HH and over 100pips from entry.....downtrend is strong, helped by a goldman sachs rumour about '...selling £ at these levels...not too low to sell here,'...subsequently retracted by mni, who say it needs definate confirmation, still a rumour! Could we now see a with trend follow thru to new intraday lows??
 
Last edited:
30min trend t/f...re post #396 above

You can see on 30min trend t/f screenshot below, that the downtrend is intact,... the immediate LH circled being the area of the last Re-entry set-up mentioned in post above.

2cmpwjt.gif
 
Still in Monthly chart potential support zone...re post #391

See screenshot below...self explanatory....a break and clear here could indeed open up the 1.0465 area lows??

zvu2r9.gif
 
Two of the most important price action observations I have made

I have detailed these observations in this thread before, but they are worth repeating...

a. The more immediate/recent obvious previous price swing hi/los tend to excercise the most influence over current price insofar as their potential for supp/res/sbr/rbs,... lest there be a really obvious previous swing in the recent past that caused a big reaction/was tested a few times

b. Price tends to test nearer to the deepest extreme of the zone lest there be obvious confluence of other potential supp/res factors elsewhere within the zone (such as fibs, t/lines etc...)


Point b. was well made again this london/European morning session with gbpusd's pullback off 3712 lows to test the deepst extreme of the 1hr potential sbr zone discussed in posts above.
 
typical trading session

In my 5hr Gbpusd actual trading session today 0830am-1330pm gmt(some prep before) across my preferred time frames of 1min (trigger,) 5min (intermediate,) and 30min (trend,) I identified 5 Hi-probability trading opportunities (set-ups,) the first of which is outlined in post #395 above. The next two are discussed in post #396 above at the H and HH on 5min screenshot posted there.

The final 2 were the 1253pm gmt 1min Reversal Extreme with 1 and 5min small charts supporting conditions @ the pot supp of the prev 1hr sw lo zone, and the 1319pm gmtRev Extr ii with 1min small chart supporting conditions @ the prev 5min swing hi x2 tests (effectively a 1min reversal in a 5min range.) All set-ups saw attractive pip gains available.

Price moved 154pips lo-hi during that 5hr period although hi-lo so far today is a little over 300pips. Effective price consolidation has set-in now on t/f's to 15min (correct at time of writing)

NB: 1hr t/f is used re prev swing hi/lo zones (price pivots) as a proxy for the 30min trend t/f, only in this respect, because 1hr is a more widely used t/f.

The screenshot below shows the 5min chart during my trading session...the point being that if you do all the prep and then wait for the confluence of the technical components of this trading system/methodology, you can find hi-probability trading opportunities in any market conditions.

I have numbered the swings at which these set-ups developed in ascending chronological order.

14jw7te.gif
 
Last edited:
Top