Best Thread COFFEE - The next big bull?

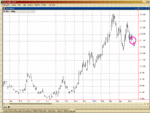
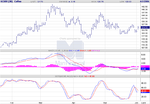
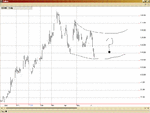
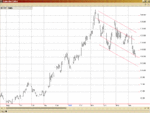
the strong run continues - especially with Robusta touching a new high on the July contract.

I have a question - I have been reading the DJ Nybot Coffee Reviews and they occasionally refer to the "Gap" - what do they mean by this? Heres the article from today:

http://my.futuresource.com/component/news/story.jsp?id=i4564256308275314752

and heres a snippet ..


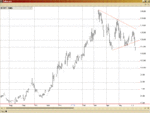
The Nybot July contract settled up 150 points at $1.1965 a pound and
September closed up 155 points at $1.2270.

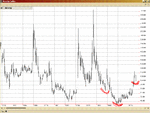
At mid-morning, July sped through a gap at $1.2075 to $1.2110 and September
filled a gap that started at $1.23.


Thanks in advance
 
The low on 5/13(Friday) was 121.10 and the high the following Monday was 120.75.
 

Attachments

  • gap.GIF
    gap.GIF
    43.1 KB · Views: 233
jklondon said:
using CS - although interested to know what spreads IB are offering.

On another note anyone care to comment on the spread between the the London and NY Markets - seems to be larger than average and may present a trade opportunity ? I assume the appreciation of the dollar since May is an key factor ..

e.g spread to narrow or outright long KCN05 position.

fscom

Sorry for my North American ignorance but what does "CS" stand for?

Just a thought on the London/New York spread, it would seen to that if people in rural Ontario have started to drink coffee made from arabica bean instead of robusta then there has been a long tern shift in demand that could continue to cause the spread between the two top widen.
 
CS = capital spreads

yep arabica and robusta are not exactly perfect subsitues but I think supply factors (or projections of supply factors) are causing the spread rather than a fundamental shift in demand ...
 
Reentered LONG Sept Arabica at 12360 today.

London continues strong, and I feel the spread may come in from here.

Vietnam default rumours are circulating.

Intially tareting DOWNTREND resistance at 13150-13250 basis Sept.
 

Attachments

  • sept coffee.png
    sept coffee.png
    23.2 KB · Views: 219
Is coffee still bubbling?

With coffee looking decidely less bullish than was the case, is anybody still long coffee?
 
I've been in and out of this market. Several days ago I bought July at 118.80 and a couple of days ago I took profit at 126.00. I thought I would buy again when it retraced to the support line I have drawn on the chart at the left. I was surprised to see the market go crashing through that support. I started looking for more support/resistance lines that would make sense to me, and what I came up with is drawn on the chart on the right.

Volume is picking up in the September contract. When the chart gives another buy signal, I'll buy September. I wish I was brave enough to trade this market both directions.

I tried to find support lines on the weekly and monthly charts, but there are too many ways to draw lines, so I'll rely on daily chart action for signals.
 

Attachments

  • JCoffee.GIF
    JCoffee.GIF
    32.1 KB · Views: 206
  • JCoffee2.GIF
    JCoffee2.GIF
    31.8 KB · Views: 198
Parabolic, trendline

Hybrid Thread

A Picture Is Worth A Thousand Thoughts, Words, Discussion & Emotion
 

Attachments

  • coffee.jpg
    coffee.jpg
    228 KB · Views: 198
So, please, discuss your thoughts...with emotion...hopefully with less than a thousand words... :)
 
Absolutely beautiful!! We're getting some symetry on the monthly chart. A huge inverted head & shoulders. We get to go back and pick up the money again, and then even more! *maybe* (well...I missed most of it the first time around.)
 

Attachments

  • KCmosym.GIF
    KCmosym.GIF
    37.7 KB · Views: 168
Gene, tnx for all your comments that i read with interest. Could u pls give me precision about the " huge inverted head & shoulders because i have difficulties to see it. Tnx in advance.
 
I see it as a possible inverted h&s in the making.
 

Attachments

  • KChs.GIF
    KChs.GIF
    38.9 KB · Views: 180
Tuesday's bar looks like a reversal. I might buy on Wednesday, and hold it until it gets back up to the top of the channel.

If this is a reversal, then the market did not go as far down as I thought it would. Could we be seeing the start of a rounded bottom? We still have a few months until the seasonal rally is supposed to hit....
 

Attachments

  • kcrev.GIF
    kcrev.GIF
    31.3 KB · Views: 158
  • kcrb.GIF
    kcrb.GIF
    29.6 KB · Views: 194
Last edited:
You could just as easily be looking at a 2 to 3 pullback from a breakout could you not ?
 
I guess so. I just trade by what I think is going to happen and I keep my finger poised over the panic button.
I believe the fundamentals won't let this market break too far, but looking at the weekly and monthly charts, I'd say there is sill a little more room to the downside. Today, though (Wednessday), I'm ready to buy if the market acts right.
 
I bought Sep at 114.90. It ain't workin' right. I'll get out and maybe try again at the next trend line below 105.00.
 

Attachments

  • kcilost.GIF
    kcilost.GIF
    32.9 KB · Views: 206
Gene,
It happens....this now seems to be coming into an area where it appears to me we are going to see some sideways action...I note that this last little B/O that knocked you out was in fact quite a bit less impressive than the last one and again I would take this to mean that the next action might be more probable to be sideways...the chart as it stands now would have me looking at the last largish upward move area 117-120 as being a position to be if I wished to be long..if it goes back there it would be confirming my expectation ...LOL ..but even that would depend on how current action infolds....
 
Last edited:
Top