Chart Patterns

My favourite s are engulfing patterns, dojis and piercing patterns with one important note. No pattern has any significance unless market structure is also considered. For example, all the patterns that I just mentioned must be at or near a S/R level.

Candle sticks are always good. My problem with them is remembering the many different sticks. ie:
Evening Doji Star
Evening Star
Hammer
Harami

and the patterns seem never ending.

I do think you have a good idea. The problem is I'd be on the learning curve forever.:whistling
 
I don't make any trade decisions off any chart patterns but this site provides really detailed analysis and statistics if that's the way you do it - http://thepatternsite.com/index.html.

A good verified chart pattern is fairly easy to make consistent money. The standard patterns are my all time favorites
  1. 123 Top / Bottom
  2. Bull / Bear Flags
  3. Symmetrical triangles
These are only a few but work pretty good for me.:rolleyes:
 
The ones that I mentioned often occur at the end of retracement/resumption of a trend. If you just look for that set up it will make you money. The rest can be learned over time. What I always hated was when some guru renamed the patterns with thier own name. That always confused me.
 
plenty of patterns showing up intraday, but you have to keep your eyes peeled and be able to react in real time.


39003384395_86e2939fe1_b.jpg
 
plenty of patterns showing up intraday, but you have to keep your eyes peeled and be able to react in real time.


39003384395_86e2939fe1_b.jpg

Scanning the chart I see quite a few good patterns. Here's the problem for me with "you have to keep your eyes peeled and be able to react in real time" My brain doesn't work that fast any longer. Age is not a trader's friend.:confused:
 
Scanning the chart I see quite a few good patterns. Here's the problem for me with "you have to keep your eyes peeled and be able to react in real time" My brain doesn't work that fast any longer. Age is not a trader's friend.:confused:

it's certainly a lot harder than it looks. lol. its nice if you can find them on a 5 minute bar so you at least have a little time to react. i'm following 8 stocks on both 1 and 5 minute bar chart intraday. i feel like its easier to find setups this way, and i only have to be in a trade for a few minutes instead of days and weeks. patterns can get scarce on the one day bar charts. the markets getting volatile so some patterns should be setting up soon.
 
move to higher timeframes? :)

I did that some time ago. I use day (Live) data and my trades are setup
for 'Trend' trading. Usually I check for an UP 'Monthly' then wait for an UP 'Weekly'. The idea is to buy on the UP Weekly. I've tuned it a bit and use the Daily to get a better entry. This is all provided by a "Paid For" service

It's relatively easy. ie; With an UP Monthly Triangle you buy on the 1st UP weekly triangle. Then Bail on the 1st down weekly. Then, when another UP WEEKLY shows; jump back in.

Do a TRADE MARKET CLUB TRIANGLES search on YouTube and you can get a better visual.

It's actually a LAZY Trader's way to trade.:cool:
 
I don't make any trade decisions off any chart patterns but this site provides really detailed analysis and statistics if that's the way you do it - http://thepatternsite.com/index.html.

Here's a thought tomorton. Chart patterns basically display the 'Psychic' of the traders. ie: Bears pushing going down.
Bulls jump in and think it's time to make a profit by pushing prices up. Bears jump back in an say "I'm short for a reason and force prices to dip back down, only not quite as far as the last push down. Then,... Bulls jump back in and retake control of the prices. It is interpreted like this.

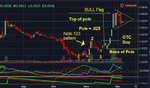
1st down turning point is #1
1st Rally peak is point #2
2nd down turning point (Not as far as the 1st down turn) is called #3

Trade entry is off the #2 point Place a GTC buy off of the, or a few ticks above the #2.

It's a classic 1-2-3 chart/price pattern That fits Bottom and Top of a price run.

Also note the 'BULL' flag following the 123 pattern. An UP Move At the Break out above the pole can advance the length of the pole; not an absolute but a good indicator for a move.

These all have excellent entry points.

another note. These patterns work just as well for a down moving market.
 

Attachments

  • 123 pattern.jpg
    123 pattern.jpg
    74 KB · Views: 476
Aye, long as you cater properly for the pattern failures (of which there are many - particularly in real time) you’re good to go.

I forgot to mention that "All Patterns" must be QUALIFIED before they can be traded.

You're right about patterns do fail. However, again, if they pass the Qualification Sniff they usually are profitable. (y)
 
the first pattern looks loose to me, while the second pattern looks tight, sharp, and near textbook symmetrical. it can get a little subjective sometimes...

I'm surprised no-one has mentioned using the patterns detected by Point & Figure analysis, Point & Figure is objective, not subjective..

Unlike candlesticks they are objective and take away the wishy-washy to and fro conversation of, is it a pattern? or isn't it?

Point & Figure works over both short and longer term trades by removing the "noise" in the price fluctuations and only plotting real changes in supply/demand.

Now I'll admit P&F threw me for a loop the first time I looked at it, but once you understand how *simple* it really is you won't go back to sh*tty candlesticks :smart:

 
Last edited:
I'm surprised no-one has mentioned using the patterns detected by Point & Figure analysis, Point & Figure is objective, not subjective.


Do you use classic P & F or the variation three box reversal of either David Fuller or the Chartcraft method?
 
Do you use classic P & F or the variation three box reversal of either David Fuller or the Chartcraft method?

Everything I initially learnt was been from the du Plessis book,The Definitive Guide to Point and Figure, 2nd Edition.

I use anywhere from 1-box to 5-box reversal depending on the number of data points being analysed, the major difference in how I use P&F compared to others is that I solely use tick data for the truest representation of supply/demand.

IMO candlesticks are totally arbitrary regardless of their 'precision' i.e. 1-minute, 2-minute, 15-minute, etc...

For example inside a 5 minute candle the price could bounce definitively off a level 10 times, but at the end of your 5 minutes you will see none of this reflected in the final drawn candlestick! In a P&F plot you will all see the 10 attempts to break through a level, and then know you're at a potentially trade-able/inflexion point.
 
I forgot to mention that "All Patterns" must be QUALIFIED before they can be traded.

What does qualification mean? Not heard of this one before.

Everything I initially learnt was been from the du Plessis book,The Definitive Guide to Point and Figure, 2nd Edition.

I use anywhere from 1-box to 5-box reversal depending on the number of data points being analysed, the major difference in how I use P&F compared to others is that I solely use tick data for the truest representation of supply/demand.

My knowledge of P & F is extremely rusty by now as I have not touched it for more than 16 years. It was a syllabus requirement for my TA diploma back then.
 
.......For example inside a 5 minute candle the price could bounce definitively off a level 10 times, but at the end of your 5 minutes you will see none of this reflected in the final drawn candlestick! In a P&F plot you will all see the 10 attempts to break through a level, and then know you're at a potentially trade-able/inflexion point.........

Won’t you only see that if the “reversal degree” is tight enough to pick up the 10 bounce backs and print the PF reversals? Otherwise the pullbacks will leave PF unmoved and you will similarly have no idea of the 10 efforts.
 
I'm surprised no-one has mentioned using the patterns detected by Point & Figure analysis, Point & Figure is objective, not subjective..

Unlike candlesticks they are objective and take away the wishy-washy to and fro conversation of, is it a pattern? or isn't it?

Point & Figure works over both short and longer term trades by removing the "noise" in the price fluctuations and only plotting real changes in supply/demand.

Now I'll admit P&F threw me for a loop the first time I looked at it, but once you understand how *simple* it really is you won't go back to sh*tty candlesticks :smart:


I checked out P&F some time ago and every once in awhile I take another look. I'm in the middle of 7 decades and these ole brain cells just ain't able to decode that much any more.:eek:
 
Top