You are using an out of date browser. It may not display this or other websites correctly.
You should upgrade or use an alternative browser.
You should upgrade or use an alternative browser.
hhmmmmm. ?
a toin coss will give a binomial distribution , yes ?
but the market isnt like that - it can stand still as well as go up or down -
just trade options and you will now what I mean as time value erodes .
unless you can get the coin to land on its edge ?
lol
I have found a random number generator very useful for testing different systems.
but the market isnt random either.
FTSE Beater
Experienced member
- Messages
- 1,518
- Likes
- 6
...and coin tossing doesn't incur commissions 🙄
Still interesting though. I wonder what happens if you apply basic money management rules, like risking 1% of capital :idea:
Still interesting though. I wonder what happens if you apply basic money management rules, like risking 1% of capital :idea:
FTSE Beater
Experienced member
- Messages
- 1,518
- Likes
- 6
Hi All
I've just worked it out, and the results are very inconclusive. Some times the capital is up 70% and sometimes down by 70%, all depending on which random numbers you use 🙄
I've just worked it out, and the results are very inconclusive. Some times the capital is up 70% and sometimes down by 70%, all depending on which random numbers you use 🙄
donaldduke
Experienced member
- Messages
- 1,665
- Likes
- 260
Interesting.
The markets are random most of the time.. so no surprise the charts might be similar.
However there are times when the herd doesn't act randomly and you can predict prices.
Also TA could be complete rubbish, but if enough people believe it then it can become a self fulling
prophecy, enough to cause a few non random patterns.
Actually alot of TA patterns only work around 50% of the time anyway, but you can use good money
management to still profit from them.
frugi
1
- Messages
- 1,843
- Likes
- 133
What might the graph look like if you allowed Bonsai a trinomial distribution (i.e head +1, tail -1 and edge 0) and knew that as the coin was unusually tall there was a 1/3 chance of each?
Lots of edgy, flat, illiquid spots to break up the trends and confuse the random TA I suppose...a bit like looking at MyTrack data...hmm must consult Paulos! :|
Lots of edgy, flat, illiquid spots to break up the trends and confuse the random TA I suppose...a bit like looking at MyTrack data...hmm must consult Paulos! :|
Last edited:
Bigbusiness
Experienced member
- Messages
- 1,408
- Likes
- 23
I think that the fact that TA works on randomly generated charts means that it doesn't matter that much if the markets are random or not. Having looked at a lot of randomly generated charts, there is some difference between them and charts of the major markets. This makes me believe that there is an element of randomness in the markets but there are also some non-random elements that make the charts look different.
It would be good to see a randomly generated candlestick chart. My spreadsheet skills aren't up to that task.
It would be good to see a randomly generated candlestick chart. My spreadsheet skills aren't up to that task.
growltiger
Member
- Messages
- 91
- Likes
- 0
Bigbusiness said:It would be good to see a randomly generated candlestick chart. My spreadsheet skills aren't up to that task.
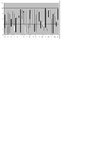
Pleas see attached for a randomly generated candlestick chart (the four series - OHLC -are independently random). It looks less coherent than the 10,000 coin tosses!
Attachments
growltiger
Member
- Messages
- 91
- Likes
- 0
Kelly rules OK
Is this a case where the Kelly formula applies? Because you have no edge in tossing a fair coin, at any finite time you could be plus or minus a fortune, even though the expectation - for infinite series of tosses - is zero (and commissions likewise). In case anyone is interested, I attach a pdf of the original Kelly paper on information and games of chance, which I found somewhere on the web.
FTSE Beater said:...and coin tossing doesn't incur commissions 🙄
Still interesting though. I wonder what happens if you apply basic money management rules, like risking 1% of capital :idea:
Is this a case where the Kelly formula applies? Because you have no edge in tossing a fair coin, at any finite time you could be plus or minus a fortune, even though the expectation - for infinite series of tosses - is zero (and commissions likewise). In case anyone is interested, I attach a pdf of the original Kelly paper on information and games of chance, which I found somewhere on the web.
Attachments
Bigbusiness
Experienced member
- Messages
- 1,408
- Likes
- 23
growltiger said:Pleas see attached for a randomly generated candlestick chart (the four series - OHLC -are independently random). It looks less coherent than the 10,000 coin tosses!
Thanks for that. I suppose in a real chart the HLC are not independent of the open. That is the bit that has flummoxed me when trying to create a random candlestick chart.
Bigbusiness
Why are HLC not independent of the open? Are you suggesting that during the day the price is constantly referring to the openening price. I appreciate that in terms of up or down it is but it is not controlled by it.
To take extreme cases what happened on 9/11, black monday etc did the price refer to the opening before dropping - I think not.. Surely OHLC are just part of a series related to one another but independent of one another
Regards
bracke
frugi
1
- Messages
- 1,843
- Likes
- 133
A more realistic way of creating a random stock price pattern might be to imagine an x sided die, say one with 21 sides, and then throw it 10000 times. The facets of the die would be numbered +1 to +10 and -1 to -10 and zero (to represent unchanged).
Then start your chart with an arbitrary stock price, say 100, and start throwing, adding each result to the running total. So you might get 100, 101, 100, 103, 102, 99, 99, 101, 102,104, 107, 105, 115, 111 etc. Then plot this on your chart as just closes. After a while it may start to look like a typical daily stock chart. I don't know how to incorporate the OHL bit though!
However stock prices do not generally move up or down by 10 as often as they move up or down by a lower number, so you might want to load the die so that the higher the number, the progressively less chance there is of it coming up. I don't know whether, for realism, this progression of chance should be logarithmic or linear. Try both perhaps. Either way the outcome then won't be truly random because it is weighted towards the lower numbers, more like a stock price movement.
Anyone fancy trying this on a spreadsheet?
We seem to have got locked into the thought that the markets are random surely they are not.
They react according to stimuli - not always in the manner expected but they do react. If they were truly random they would be pinging around all over the place (try a random number generator), instead they follow some sort of pattern which is what we try to latch on to. If they were truly random Fibonacci and all the rest of them would be useless as they use patterns to predict.
Regards
bracke
Bigbusiness
Experienced member
- Messages
- 1,408
- Likes
- 23
bracke,
If you look at your candlestick chart, the close of one bar and the open of the next are not similar. This can happen with daily charts but most of the time the close of one bar will be fairly close to the open of the next. I also think that the average up candlestick will open near to the previous days close, move lower to the low of the time period, then move above the open price and to a new high before falling to the close price. I think a random candlestick chart could be generated that would look more similar to a stock chart but I don't know how to do it. Using independently random numbers for the OHLC doesn't fit in with what I had in mind. I was thinking of using the running total of the coin toss results like tick data and compiling the OHLC candlesticks from that.
If you look at your candlestick chart, the close of one bar and the open of the next are not similar. This can happen with daily charts but most of the time the close of one bar will be fairly close to the open of the next. I also think that the average up candlestick will open near to the previous days close, move lower to the low of the time period, then move above the open price and to a new high before falling to the close price. I think a random candlestick chart could be generated that would look more similar to a stock chart but I don't know how to do it. Using independently random numbers for the OHLC doesn't fit in with what I had in mind. I was thinking of using the running total of the coin toss results like tick data and compiling the OHLC candlesticks from that.
frugi
1
- Messages
- 1,843
- Likes
- 133
Bracke,
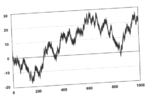
Yes, if you use a random number generator to define the (daily, or whatever) price then it will ping all over the place, but if you use it to define the price movement instead you end up with a graph much like ukDan's at the top, especially if the lower price movements are more frequent than the higher ones. A coin toss is the simplest form of this random running total as there are only two outcomes. However a chart with more outcomes, such as I mentioned before with a 20 sided die, will inevitably have plenty of "TA patterns" to chew on.
I do not believe markets are truly random either, since human psychology is involved (en masse this psychology must cause some sort of non random patterns as we are apt to repeat, or at least echo, our behaviour in similar situations).
Also, as mentioned before a lot of TA becomes a self fulfilling prophecy as we actually create support, resistance etc. by all doing roughly the same thing at the same time.
Here's some savage maths, plenty of which is above my head, but there is some interesting stuff to be dug out.
http://home.golden.net/~pjponzo/Random_Walks.htm
temptrader
Well-known member
- Messages
- 393
- Likes
- 55
the strong law of large numbers states that if this experiment was to continue indefinitely then the probablity of head will stabalise to one half as required . . .
in another words the losses and gains would cancel themselves on the assumption that the coin is "fair".
Also computers cannot, in theory, generate random numbers as such . . .
in another words the losses and gains would cancel themselves on the assumption that the coin is "fair".
Also computers cannot, in theory, generate random numbers as such . . .
growltiger
Member
- Messages
- 91
- Likes
- 0
Large numbers no defence
They can't, but the pseudo-random numbers that they generate are generally taken as random enough for this sort of purpose.
And certainly it is a fact (or consequence of the fair coin assumption) that the outcome approximates as close to 50/50 as you like if you choose a large enough number of trials. But the problem is that this leaves room on the way for as lengthy a sequence of tails (losses) as you care to specify. So the mathematical expectation of a break-even result in the limit is no guarantee that you will not go bust on the way, just as you have the chance of becoming fabulously rich from a protracted sequence of heads......
temptrader said:the strong law of large numbers states that if this experiment was to continue indefinitely then the probability of head will stabilise to one half as required . . .
in another words the losses and gains would cancel themselves on the assumption that the coin is "fair".
Also computers cannot, in theory, generate random numbers as such . . .
They can't, but the pseudo-random numbers that they generate are generally taken as random enough for this sort of purpose.
And certainly it is a fact (or consequence of the fair coin assumption) that the outcome approximates as close to 50/50 as you like if you choose a large enough number of trials. But the problem is that this leaves room on the way for as lengthy a sequence of tails (losses) as you care to specify. So the mathematical expectation of a break-even result in the limit is no guarantee that you will not go bust on the way, just as you have the chance of becoming fabulously rich from a protracted sequence of heads......
We appear to be defining random to suit our own ends, particularly if we set tight parameters eg. random between 1 and 5 - its going to be 1,2,3,4, or 5, yes its random but within tight confines.
If the markets operate in patterns ( there seems to be agreement that they do ) then they cannot be random. Even if tight parameters are set the price is not obtained by taking a number out of a hat but by the reaction to buyers and sellers to the information that they receive
People ( mostly ! ) do not decide to buy or sell the markets on a random basis they do so on information received and their perception of it. Tick data is the result of peoples decisions it is not based on coins, dies or any other random generator. If you are attempting to forecast the market you look to price movement and/or indicators, these are not random.
The comparison with coin tosses ( and dies ) cannot be correct. Over an long period of time heads will equal tails, and the die results will be evenly distributed over the die.
Viewing graphs of indices over a long period shows heads win the day ( cotinuing up )
I think that the randoms among us are trying to 'shoehorn' the random approach into the pattern approach, it won't do.
Regards
bracke
Similar threads
- Replies
- 9
- Views
- 4K
- Replies
- 0
- Views
- 2K
- Replies
- 6
- Views
- 4K