cc. - clinton cards

what do you think of clinton cards?

  • this is a great chart, this baby's gonner move!

    Votes: 5 62.5%
  • the chart is awful, get some ta training

    Votes: 0 0.0%
  • I'm not sure, we'll have to wait and see.

    Votes: 1 12.5%
  • I don't know I'm only here for the beer.

    Votes: 2 25.0%

  • Total voters
    8
Messages
549
Likes
2
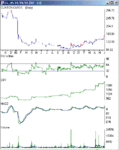
clinton cards held their agm yesterday and have recently broken out from a cup/saucer with handle pattern.

currently trading at 155p just above the resistance level from the dead cat bounce in jan 2000. There's not much in the way of resistance levels between here and 240p where they traded before falling from favour.

any views?
 
This is one of my favourites, bought in at 128 for the precise reason identified by darthtrader. This is also an old favourite of Jim Slater - low PEG etc. Up another 7.5 today. Which is nice.
 
Thanks for your comment Roger.

I bought into CC. today and a number of other stocks with similar chart patterns this week. There are some very attractive opportunities out there at the moment I think.
 
Roger,

as you are a connoisseur of cups and saucers I wonder if you tell me if they are so rare as books suggest?

are we currently seeing so many due to the position within the general market cycle (ie. the bottom) or do you find that different sectors turn at different times and provide a constant source of supply?

Thanks.
 
AIQ Chart

Here's a screen grab of CC. from AIQ, to give you a quick idea of the chart..
 

Attachments

  • ccchart.gif
    ccchart.gif
    14.3 KB · Views: 440
This turned into a nice thread on CC. Thanks for the screen shot, sharky...and also for fitting it at screen size so we don't have to use the bars to see it bit by bit...I wonder if you can tell others how to fit it in the screen in future...usually aiq charts appear very large here...

Riz
 
Cup/Saucer

Darth

Please explain the cup / saucer pattern on the chart

Thanks

Mark
 
Hiya Riz!

Yeah the trick to keeping the window not soo wide it pushes everything off the page, is simply ro resize it in AIQ Charts, you can minimise/resize/maximise the chart window - so just resize it to your required width and adjust the time frame so you get all the pattern in. I then take a screen shot with Alt-Print Screen, which mean it doesn't take all the screen just the window you have selected. But this still includes all the AIQ Charts window, so in your graphics program, I use Macromedia Fireworks, but you could PSP (Paint Shop Pro) which is shareware, and crop the picture so you just get the chart itself. Then save it as a gif, and upload it to your post.

And one other thing, I notice your wizard pic isn't showing anymore. You know this one..

wizard6.gif


so just change your img link to http://harrythecat.com/graphics/h/wizard6.gif to get to it. They must have reshuffled their files. Gosh aren't a nice chap!! LOL


Sharky.
 
Hehe..

He certainly is a nice fellow...that's apart from stealing my wizzard of course :)

Riz
 
here's a url with a nice description:

http://stockcharts.com/education/What/ChartAnalysis/cuphandle.html

I see this as more of a saucer ie. a rounding bottom that is more shallow than a cup. The handle is a smaller dip on the right .

a key factor is the appearance of a resistance level that is not breached for a long period of time. Eventurlly when the stock has been accumulated sufficiently it explodes through the resistance and starts to move as the news flow increases and the stock becomes more widely known.
 
Found this as an example of a cup and handle..

070699sgi.gif


On The Chart

The cup and handle pattern created since late 1997 is unmistakable. The 'cup' portion of the pattern began October 6, 1997 after SGI surprised Wall Street with a weak earnings forecast. SGI shares plummeted better than eight points that day. Several months later the stock was still working lower, ultimately reaching a low of 7 5/8 almost exactly one year later. Following that low SGI shares began to come back. On February 2, 1999 SGI reached a high of 20 3/8 before aggressive sellers surfaced. This rally completed the 'cup' of the cup and handle formation. Coincidentally, the rally to 20 3/8 was also a test of the primary long term technical downtrend. Since early February of this year SGI shares have been sliding lower. On May 17 of this year SGI reached a low of 12 5/8. We feel that low constitutes the apex of the handle of the cup and handle pattern and a rally through the technical downtrend at 18 would complete the 'handle' of the pattern.

At this stage a rally through 18 on better than average volume would be an important upside breakout and should ignite the next period of explosive gains for SGI. The implied technical target following an upside breakout is 12 3/4 points or a rally to 30 3/4.

What is a Cup and Handle?

Trench Warfare

Cup and Handle patterns have become favorites among Wall Street traders for a very good reason, they usually work.

Like most technical patterns the cup and handle pattern is all about the age old battle between bulls and bears. The left side of the pattern, that is the period that occurs after the initial near vertical move, is all about buyers' remorse.

After a lengthy move "johnny-come-lately" buyers realize that the fat gains traders enjoyed in the previous weeks have come to an abrupt end. As these buyers rush to liquidate positions the stock falls precipitously.

After several weeks of poor tape action the stock finds a point of equilibrium. Buyers and sellers are undecided about the near term prospects for the stock. Volume slows and the stock trades in narrow range. But bulls will be bulls. Because the stock has stopped declining, bulls become more comfortable and the stock begins to rally, pushing all the way to the previous highs.

It is at this point that sellers return and the stock begins to move lower immediately. But selling pressure does not last long, bulls are winning the battle. Within weeks the stock is again back to the previous resistance level. This time bulls have the numbers, they push through resistance, volume swells and the stock explodes higher.

How are Technical Targets Derived?

As with all technical patterns, it is very easy to determine technical targets. With cup and handle patterns the technical measure is derived by applying the depth of the 'cup' to the breakout level.

In the case of Silicon Graphics (SGI) the technical target 30 3/4. (depth of the cup (20 3/8 less lowest point at 7 5/8) plus breakout level (18)).

Vital Signs, When Technical Patterns Fail

Volume is Vital

The most important factor of any technical pattern is volume. It is very important that volume decrease as the stock reaches the bottom of the cup. This is point of great indecision and should be characterized by sharply reduced volume. Finally, volume MUST increase following any rally through the breakout level. An increase in volume is the technical traders' signal that bears have finally surrendered.

Pretty Pictures Make Good Trades

Never underestimate the importance of the key aspects of a technical pattern. Generally, after the breakout level is penetrated this level becomes key support. This level must not be penetrated. In some cases a stock will record an upside breakout, the price will move 2-3% and then return to test the breakout level. As long as this level holds the pattern remains valid but if the level fails for any reason positions should be closed.

By Salvatore Martinez
Technical Analyst
Bedford and Associates
originally posted 07/06/99
http://www.baresearch.com/memchart070699.htm


ps. Riz, don't forge to add the [/img] at the end of your img url.
 
Darth - not sure I am a connoisseur! The only other convincing saucer bottom that I can remember spotting as it happened was EBQ last year, at about 30p, and I sat and watched it go up, and up and up - now 92 , without acting on it.

I think major topping and bottoming patterns will occur in clusters as markets or sectors turn, and I would expect to see more saucer bottoms, or cups with handles, at the present than in, say, a bull market, just as H&S tops leapt of the screen in their dozens at the start of the Tech slide. I still remember looking at the break in the neckline of the H&S top for Bookham at around 3500 with a measures move to below £10, and just not believing the chart.
 
Believe in TA!.....What you see is what you are going to get.(mostly).... :)
As for Cup and Handles, you can see then in TA indicators as well, and are equally valid.....Look at TCI for KSS(knowledge support). I know it's not there yet, but wait and see......
I missed a similar classic discussing the DOW on Friday afternoon, showing some of the people in the chat room what positive divergence looks like and what it means...
following this the dow promptly did a phoenix job and rose 184 points, virtually non stop!
Ah well, next time.
 
Hi Martin,
there are a lot of people out there who rank chartism/TA with reading tea leaves and astrology. In fact when I see one of the talking heads on tv saying this I wonder if there are just trying to obscure the issue or how they manage to keep their job!

You're right about indicators - in fact they clearly roll over as the handle forms and again when the first pull back takes place after the breakout. It's just whatever works best for each individual...
 
CC. is still trying to break through 160p.

I notice that yesterday there was a large trade of 750K shares flagged as sell. Closer inspection shows it was a cross trade:

Cross at the Same Price
A transaction was effected as an agency cross or a riskless principal transaction at the same price and on the same terms (this requires one trade report).

Could this mark the start of the breakthrough?
 
Short term, I'm a little cautious with regards to this one, it's price patern may have form a short term topping patern (DOUBLE TOP) with indicators pointing to a downward move.
If the price falls below 148, then it may test its upward support level of 141.

Regards
Sparky
 
Thanks Sparky.

I know what you mean, the chart is a bit of mess. If it does fall I think you are right that there should be support around 140p
 
Top