Systematic or discretionary? It's an important question on the way to trading success. Most traders eventually end up belonging to either one or the other philosophical camp. In this article, Harald Weygand introduces an approach that most likely will interest the discretionary traders among our readers.
Traders and chartists can be categorised in various ways. Among the possibilities are system traders and intuitive chart readers. System traders develop a comprehensive set of rules, weighing statistics, utilising vast arrays of indicators and weaving intermarket correlations. Finally they combine several systems after extensive back testing. The computer, not the person, screens the market applying the system. System traders with statistics on their side can set rules for drawdowns and quite effectively remove the problem of emotions from their trading. In other words, everything is contained within the system and decisions boil down to a simple yes or no.
The classic chart reader on the other hand is different. This is a person reading a chart almost like a book. The reading aids he uses are the tools of classic chart analysis such as trend lines, price formations, Fibonacci ratios, Elliott-Wave theory and Bollinger bands.
In this article we look at the so-called high, "fast"-falling triangle formation, which can be utilised successfully by the intuitive and subjective chart reader. Price formations play a large role in the school of classical chart analysis. The "fast"-falling triangle is a variation of the classic falling triangle formation. Quick and easy to use, these set-ups can be very profitable and are great for trader's preferring simple low-risk entries.
The Strategy's Logic
High, "fast"-falling triangles tend to appear at the end of a strong upward price move, but steep rallies leading to the formation are not necessarily a prerequisite. These highly bearish formations with their reversal character often lead to strong downward price movement in a short period of time. In fact, market price can literally implode, making this set-up very attractive to short sellers.
The Rules are Simple
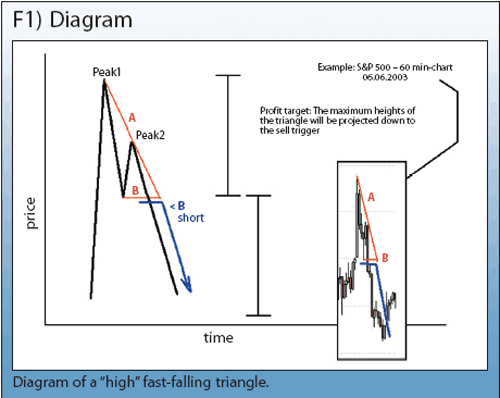
The high, "fast"-falling triangle is a hybrid-formation combining elements of the well-known double-top and the classic falling triangle. It's made up of two peaks (figure 1). The top of the second peak should be clearly lower than the first. The two peaks should be similar in form - small, pointy, high and preferably of the same width. As a whole the formation should be higher than it is wide. The top edge (A) should have two resistance points, the bottom edge, (B) only one support point. That's the similarity to the double top, which typically has just one point of support. According to classical definition, a triangle should have two support points, but not in this case. The word "fast" here implies that only these three touch- points create the formation. They indicate maximum opportunity leading to potentially fast moves.
There are a couple of other features to look for in a good formation. It helps when other bearish price patterns appear within the triangle itself, i.e. the second peak forming a small double top. Another desirable quality is the appearance of a small bullish pattern or a bullish candle (i.e., Hammer) at the triangle's support point along the bottom edge.
Trading Applications
The support point along the triangle's bottom (B) is used as a sell trigger. If price violates this level a sell order is placed. If fact, any price under the trigger can be considered a selling point. If a specific time frame is used, then simply wait for the next close under the trigger before selling. For example, in a weekly chart a weekly close under the sell level is the signal. In a 60-minute chart the hourly close determines entry. In figure 1, the blue arrow in the diagram shows the entry and resulting move. A stop should be placed slightly above the entry point (B) depending on the time frame. Stops should be relatively tight, because any noteworthy move back above the entry price might lead to formation of a bull flag, making short positions undesirable. However, experience shows that a move above the entry often leads to a pennant formation. The trade's target price is calculated by measuring from the triangle's highest point to the trigger line and projecting downward. Figure 1 also shows an example seen on a 60-minute chart of the S&P 500 index.


What drives this formation?
The triangle's first peak usually forms at the end of a longer trend that starts to heat up. Ideally, the price nearly explodes straight upward at the end of the move. The first top forms when market participants begin selling larger positions in response. At the same time, demand fails after the euphoric run-up and participants notice the hype is over. A drastic change in sentiment begins. Peak two represents the final blow-off, as an attempted retest of the first top fails. That's why the second peak should be noticeably lower than the first. It demonstrates the disillusionment of the masses that previously had traded the market up. During the run-up, the masses feel they will be left out and jump onboard. The first peak unfolds when holders of the stock realise prices have climaxed and begin selling to capture the still high levels. "...Oh no, we will never see those prices again, I've got to sell now or miss it..." The second top appears as sellers dominate and now accept prices far below peak one. You might ask why the single support at the bottom of the triangle and why peaks must be steep and as small as possible? The answer is the speed of sentiment-change, it should happen rapidly and drastically. The trader must really see panic in the market.
The rapid formation of the high, "fast"-falling triangle also indicates an increase in the price momentum of the investment instrument. Momentum in this case is understood as level of order flow per unit of time. All orders must pass through the same eye of the needle so to speak. Sell orders triggered by prices breaking through support must also pass through this narrow passage causing even more downward pressure - high momentum as a sign of increasing panic.
Preferred Markets, Time Frames, and Charting
Fast triangles work great with stocks, especially with US-stocks. Commodities and currencies also work well. Less satisfactory is the Dax and Fdax, where a re-break back through the sell trigger often occurs, forming a so-called blurred or washed-out falling triangle. Fast triangles work just as well with long-term time frames using monthly and weekly charts as they do with short-term and intraday time frames using the 60-, 30-, 15-, and five-minute intervals.
Conclusion
High, "fast"-falling triangle formations are easy to use for intuitive chartists. The method is simple and drawdowns can be kept to a minimum with the use of tight stops. A good formation promises high profits for short-sell trades within a short amount of time. However, they can be rare and do not function in all markets.
Traders and chartists can be categorised in various ways. Among the possibilities are system traders and intuitive chart readers. System traders develop a comprehensive set of rules, weighing statistics, utilising vast arrays of indicators and weaving intermarket correlations. Finally they combine several systems after extensive back testing. The computer, not the person, screens the market applying the system. System traders with statistics on their side can set rules for drawdowns and quite effectively remove the problem of emotions from their trading. In other words, everything is contained within the system and decisions boil down to a simple yes or no.
The classic chart reader on the other hand is different. This is a person reading a chart almost like a book. The reading aids he uses are the tools of classic chart analysis such as trend lines, price formations, Fibonacci ratios, Elliott-Wave theory and Bollinger bands.
In this article we look at the so-called high, "fast"-falling triangle formation, which can be utilised successfully by the intuitive and subjective chart reader. Price formations play a large role in the school of classical chart analysis. The "fast"-falling triangle is a variation of the classic falling triangle formation. Quick and easy to use, these set-ups can be very profitable and are great for trader's preferring simple low-risk entries.
The Strategy's Logic
High, "fast"-falling triangles tend to appear at the end of a strong upward price move, but steep rallies leading to the formation are not necessarily a prerequisite. These highly bearish formations with their reversal character often lead to strong downward price movement in a short period of time. In fact, market price can literally implode, making this set-up very attractive to short sellers.
The Rules are Simple
The high, "fast"-falling triangle is a hybrid-formation combining elements of the well-known double-top and the classic falling triangle. It's made up of two peaks (figure 1). The top of the second peak should be clearly lower than the first. The two peaks should be similar in form - small, pointy, high and preferably of the same width. As a whole the formation should be higher than it is wide. The top edge (A) should have two resistance points, the bottom edge, (B) only one support point. That's the similarity to the double top, which typically has just one point of support. According to classical definition, a triangle should have two support points, but not in this case. The word "fast" here implies that only these three touch- points create the formation. They indicate maximum opportunity leading to potentially fast moves.
There are a couple of other features to look for in a good formation. It helps when other bearish price patterns appear within the triangle itself, i.e. the second peak forming a small double top. Another desirable quality is the appearance of a small bullish pattern or a bullish candle (i.e., Hammer) at the triangle's support point along the bottom edge.
Trading Applications
The support point along the triangle's bottom (B) is used as a sell trigger. If price violates this level a sell order is placed. If fact, any price under the trigger can be considered a selling point. If a specific time frame is used, then simply wait for the next close under the trigger before selling. For example, in a weekly chart a weekly close under the sell level is the signal. In a 60-minute chart the hourly close determines entry. In figure 1, the blue arrow in the diagram shows the entry and resulting move. A stop should be placed slightly above the entry point (B) depending on the time frame. Stops should be relatively tight, because any noteworthy move back above the entry price might lead to formation of a bull flag, making short positions undesirable. However, experience shows that a move above the entry often leads to a pennant formation. The trade's target price is calculated by measuring from the triangle's highest point to the trigger line and projecting downward. Figure 1 also shows an example seen on a 60-minute chart of the S&P 500 index.


What drives this formation?
The triangle's first peak usually forms at the end of a longer trend that starts to heat up. Ideally, the price nearly explodes straight upward at the end of the move. The first top forms when market participants begin selling larger positions in response. At the same time, demand fails after the euphoric run-up and participants notice the hype is over. A drastic change in sentiment begins. Peak two represents the final blow-off, as an attempted retest of the first top fails. That's why the second peak should be noticeably lower than the first. It demonstrates the disillusionment of the masses that previously had traded the market up. During the run-up, the masses feel they will be left out and jump onboard. The first peak unfolds when holders of the stock realise prices have climaxed and begin selling to capture the still high levels. "...Oh no, we will never see those prices again, I've got to sell now or miss it..." The second top appears as sellers dominate and now accept prices far below peak one. You might ask why the single support at the bottom of the triangle and why peaks must be steep and as small as possible? The answer is the speed of sentiment-change, it should happen rapidly and drastically. The trader must really see panic in the market.
The rapid formation of the high, "fast"-falling triangle also indicates an increase in the price momentum of the investment instrument. Momentum in this case is understood as level of order flow per unit of time. All orders must pass through the same eye of the needle so to speak. Sell orders triggered by prices breaking through support must also pass through this narrow passage causing even more downward pressure - high momentum as a sign of increasing panic.
Preferred Markets, Time Frames, and Charting
Fast triangles work great with stocks, especially with US-stocks. Commodities and currencies also work well. Less satisfactory is the Dax and Fdax, where a re-break back through the sell trigger often occurs, forming a so-called blurred or washed-out falling triangle. Fast triangles work just as well with long-term time frames using monthly and weekly charts as they do with short-term and intraday time frames using the 60-, 30-, 15-, and five-minute intervals.
Conclusion
High, "fast"-falling triangle formations are easy to use for intuitive chartists. The method is simple and drawdowns can be kept to a minimum with the use of tight stops. A good formation promises high profits for short-sell trades within a short amount of time. However, they can be rare and do not function in all markets.
Last edited by a moderator:

