Candlesticks not profitable Massey University Research

Do Candlesticks work or not?


  • Total voters
    135
The big mystery...is always a big mystery if there are two main elements missing in order to facilitate a solution. The first is incomplete information...:LOL: ...and the second is where a scenario could be interpreted to mean different things and hence produce different outcomes.

And when these outcomes turn out to be the opposite to the ones expected it would not occur to anyone to disregard the underlying causes but to review what if any information is missing ..:LOL:

The difficulty often is that on occasion candlestics behave perfectly and develop perfectly in line with expectatons and at other times they do not, the reason for this being imperfect interpretation, because no one in his right mind is going to go out of his way to get it persistently wrong on purpose.

This is not necessarily the fault of the observer, it is because of the way markets are constructed and are made to operate.
 
There's a lot to be said for simple. The gurus like to make a big mystery of it all because their egos require a great deal of care and feeding. But there's no mystery. It's all there for anyone to see who is willing to put in the time and effort. But that means that the trader is going to to have to do the work rather than search for something -- like candles, or moving averages, or MACD, or . . . -- to do the work for him. :)

Db

Exactly, at last. On this exceptional occasion, Very Good.:LOL:
 
"The Massey University Finance Dept. carried out research by Ben R. Marshall, Martin R. Young and Lawrence C. Rose, Dept. of Finance established from their research that candlesticks do not work and are not profitable, this research was released 16 April 2007."

Yeah, no ****?

How pathetic that a bunch of PHD's using an immense amount of time and energy come up with absolutely nothing.

A perfect example of how ignorant some of the most educated people are.

DT
:)

You have to understand that Academic research is, in the main, totally narrow minded. That way they can have control over the parameters of the experiment so they don't get out of hand. Having a PhD doesn't mean you're clever, it just means you reached an a certain academic grade and have done sustained research on a very specialized subject area over a period of time.

I find this thread strange, because I use candles. And the comment that jacinto was referring to was by Skimbleshanks, but then again she also said horses for course.

There is absolutely no difference between candles and bars from the point of view of conveying information. The might be psychological factors why candles are worse than bars to certain people and how they trade.

The latter comment itself is worth a long pointless academic study, because they'll do the study with a very narrow set of parameters and reach a conclusion that is of no practical use to anyone.

I suppose the study is definitely a candidate for the IgNobel prize.
 
(this entire thread seems to have been railroaded into not advertising for something or other, or gold-leaf ledgers or the same old MACD indicators (Merit, Ability, Conduct, Discipline :))

the chart of this thread is currently one of engulfing bull.
now, how about a lead-weighted candle, in the drawing room, with a glancing blow across the left temple.
followed by a gravestone doji.

so, to return to the topic, about the research about whether candlesticks work or not......

What more is there to debate? I gave my opinion in post 20. Whether they "work" is what the trader chooses to read into them. A candle gives the information, in bar form, that it was designed to give.

Split
 
(this entire thread seems to have been railroaded into not advertising for something or other, or gold-leaf ledgers or the same old MACD indicators (Merit, Ability, Conduct, Discipline :))

the chart of this thread is currently one of engulfing bull.
now, how about a lead-weighted candle, in the drawing room, with a glancing blow across the left temple.
followed by a gravestone doji.

so, to return to the topic, about the research about whether candlesticks work or not......

I've done a bit of housekeeping and removed the diversion to http://www.trade2win.com/boards/showthread.php?t=25384

jon
 
What more is there to debate? I gave my opinion in post 20. Whether they "work" is what the trader chooses to read into them. A candle gives the information, in bar form, that it was designed to give.

Split

Yes, agreed. Not only what happens inside the candle is important but in a bearish candle what happens inside the top wick is crucial and in a bullish candle what happens inside the bottom wick is crucial.

Why are all the posts attacking me being deleted.

You are spoiling all my fun.

But I have all of them and my replies recorded and available for anyone who wishes t read them...but not here.:LOL: They are stored in a restricted area designeated "the monkey warehouse".:LOL:

This post is recorded as well.
 
Correction

The correct location is the Monkey Business Warehouse and not the Monkey Warehouse, sorri.:LOL:
 
The correct location is the Monkey Business Warehouse and not the Monkey Warehouse, sorri.:LOL:

Well, I hope you've included your own posts where they have been insulting or provocatively rude. As I have said before, rudeness is rudeness whether it be in initiation or in response.

Anyway let's not go down this road and start yet another diversion from the topic :devilish:

good trading

jon
 
Yes, agreed. Not only what happens inside the candle is important but in a bearish candle what happens inside the top wick is crucial and in a bullish candle what happens inside the bottom wick is crucial.

But, is it necessary to display this information as a candlestick in order to understand what is going on? Is it the intent which makes the candlestick or is it the other way around? :confused:
 
But, is it necessary to display this information as a candlestick in order to understand what is going on? Is it the intent which makes the candlestick or is it the other way around? :confused:

The intent is always, or nearly always present. It is made manifest by the price action. Sometimes the manifestation is made clear and sometimes not. All of the recorded price action is contaiined within the candle, because the candle records all of the price action in columnar form for a given time period.

Someone ventured to postulate the hypothesis the other day that the candle drives the price (either DB or VSA Trader, I do not correctly remember, but no matter).... but I assure you it is not correct. The candle simply records the track of the price over a given period of time.

The candle, whether bullish or bearish, shows the open, the close, the high and the low. What it does not show is the progression of the price with all its oscillations that occurred within that specific timefreme allocated to it.

I hope and expect this helps.
 
recently i'm stop using candlestick and trading using line chart...

seems profitable

well candlestick is good to identify reversal perhaps
 
The candle, whether bullish or bearish, shows the open, the close, the high and the low. What it does not show is the progression of the price with all its oscillations that occurred within that specific timefreme allocated to it.
Yes - the body and wick represent prices at specific points in time during the time interval the candle covers. The same applies with the structure of a bar.

As I specified on another thread I would recommend, as an exercise, that price is followed in real time (at least from time to time). During the interval of creation of a candle/bar the observer will experience how/if it gradually/suddenly elongates from the opening price. The observer will also observe the acceleration and deceleration of the elongation or the moving of the current price between the high/low or see it create a new high/low.

Furthermore if this is accompanied by observing the level 2 screen the movement and volume of orders can be compared to the candle/bar formation in real-time and the price at which trades take place. Again an examination of the acceleration/deceleration/resting activity times can be very illuminating

In this fashion the "story" contained within the static completed candle/bar can be better interpreted.

Charlton

I second that. I was actually about to post something very similar as a reaction to that sentence of Socrates, but credits to you Charlton.

Watching candles form in real time has been of invaluable worth to me. A candle is after all only a static representation of something that happened during 1, 2, 5, 15, 30 minutes (or whatever higher timeframe one chooses to observe). Looking at the tape and evaluating the buying and/or selling pressure "live" will give you a much better understanding of why price is reacting the way it is.

Level 2 is not necessary imho. It might be an extra help, but I've never relied on it and I've been able to do okay without.
 
Yes - the body and wick represent prices at specific points in time during the time interval the candle covers. The same applies with the structure of a bar.

As I specified on another thread I would recommend, as an exercise, that price is followed in real time (at least from time to time). During the interval of creation of a candle/bar the observer will experience how/if it gradually/suddenly elongates from the opening price. The observer will also observe the acceleration and deceleration of the elongation or the moving of the current price between the high/low or see it create a new high/low.

Furthermore if this is accompanied by observing the level 2 screen the movement and volume of orders can be compared to the candle/bar formation in real-time and the price at which trades take place. Again an examination of the acceleration/deceleration/resting activity times can be very illuminating

In this fashion the "story" contained within the static completed candle/bar can be better interpreted.

Charlton

yeah, absolutely agree (although in forex, i dont get volume, so no comment there).

although i have stopped doing it for no reason (and i should start again), blending bars (i.e adding say, 60 min bars to understand 4hr bars) is the best price reading training i have had.

good point.

j
 
Yes - the body and wick represent prices at specific points in time during the time interval the candle covers. The same applies with the structure of a bar.

As I specified on another thread I would recommend, as an exercise, that price is followed in real time (at least from time to time). During the interval of creation of a candle/bar the observer will experience how/if it gradually/suddenly elongates from the opening price. The observer will also observe the acceleration and deceleration of the elongation or the moving of the current price between the high/low or see it create a new high/low.

Furthermore if this is accompanied by observing the level 2 screen the movement and volume of orders can be compared to the candle/bar formation in real-time and the price at which trades take place. Again an examination of the acceleration/deceleration/resting activity times can be very illuminating

In this fashion the "story" contained within the static completed candle/bar can be better interpreted.

Charlton

good point Charlton.
I have myself wondered whether there is more information within a bar, especially on the dailies. ie, where has the price spent most of its time, or whether the high or low were caused by spikes, or whether price spent a lot of time getting there.
watching real-time bar formation is useful, as you can see spurts up/down, and the retrace taking ages.
or whether in a down-bar, the price struggled to rise, but then fell precipitously.
that is, for a given pip-range, how many bars did it take to rise a given amount, and how many it took to fall thr same amount.
but I have never been able to quantify or make any meaningful use of this, although the price where the price seems to fluctuate the most I determine to be a possible change of sentiment. (support/resistance)

dunno, thats why I still need my indicators.
 
I have myself wondered whether there is more information within a bar, especially on the dailies. ie, where has the price spent most of its time, or whether the high or low were caused by spikes, or whether price spent a lot of time getting there.
watching real-time bar formation is useful, as you can see spurts up/down, and the retrace taking ages.
or whether in a down-bar, the price struggled to rise, but then fell precipitously.
that is, for a given pip-range, how many bars did it take to rise a given amount, and how many it took to fall thr same amount.
but I have never been able to quantify or make any meaningful use of this, although the price where the price seems to fluctuate the most I determine to be a possible change of sentiment. (support/resistance)
You could increase the bar/candle resolution and overlay volume at price?
 
candlesticks

Why not post some examples of candlesticks and how you use them in your trading or how one could use them. It doesn't necessarily have to be examples from your own experience. Then this thread might focus on something practical rather then something esoteric.

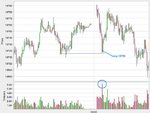
I'll start with an example of my own, from yesterday's YM trading.

I went long on a potential capitulation candle: a wide spread body on huge volume in a downmove. Whether this is a good trade or not, I'll leave it in the middle, that's not what this is about anyway. Focusing on the candle itself: it's a marubozu that spreads over about 30 points (quite a lot) and when I was looking at the chart in realtime there suddenly came in huge volume, at around the same price level as the last swing low of the previous day (potential support).

Perhaps not the best example of candlesticks' use (shooting stars, hammers, etc...) but it's one that works for me. Obviously it's a trade based on several elements, and candlesticks is only one of them.
 

Attachments

  • ym_capitulation.jpg
    ym_capitulation.jpg
    45.8 KB · Views: 196
Top