You are using an out of date browser. It may not display this or other websites correctly.
You should upgrade or use an alternative browser.
You should upgrade or use an alternative browser.
The Leopard
Experienced member
- Messages
- 1,877
- Likes
- 1,021
If you are looking for the high and low points, I would use the highs and lows.
If looking for the closes, I would use the closes.
If looking for the closes, I would use the closes.
If you wait for the bar to complete, you'll probably use the close. Sometimes,I use a 1 bar average on a candle, or bar chart, that will give you, automatically, a line chart through the bars.
In the end, it's all personal preference, though, and there is nothing written in stone.
In the end, it's all personal preference, though, and there is nothing written in stone.
I'm a begginer, so I didn't quite understand what you mean.
I'll explain my problem in more details 🙂 :
because I thought that If I use the high and low values - I might get contradicting trends by looking at them.
Suppose the chart contains several candles with the same closing and opening value but their high values increase until time X and decrearse after it, while their low decrease until time X and increase after it.
This will give us in time X a low point when looking at the low values but a high point when looking at the high values, so which is it?
If I'll look at the closing value of a candlestick which can be a high point and there's a candlestick that close a little lower, but its high value is higher than the first candlestick, which of them should be considered as the high point? 🙂
Last edited:
I do not know the answer to that question. All these peaks and lows are, in any case, approximate and lie in zones, or bands, that can be many points apart. A high is just a reversal and means no more than that. You should be aware of them and watchful of a reversal but they can, and frequently do, carry on in the same direction
There is nothing mathematical about TA and your decisions are as good as anyone else's
There is nothing mathematical about TA and your decisions are as good as anyone else's
Shakone
Senior member
- Messages
- 2,460
- Likes
- 665
I'm a begginer, so I didn't quite understand what you mean.
I'll explain my problem in more details 🙂 :
because I thought that If I use the high and low values - I might get contradicting trends by looking at them.
Suppose the chart contains several candles with the same closing and opening value but their high values increase until time X and decrearse after it, while their low decrease until time X and increase after it.
This will give us in time X a low point when looking at the low values but a high point when looking at the high values, so which is it?
If I'll look at the closing value of a candlestick which can be a high point and there's a candlestick that close a little lower, but its high value is higher than the first candlestick, which of them should be considered as the high point? 🙂
Trend is something you define for yourself.
A classical definition of an uptrend might be that we have higher highs and higher lows. Equally you could decide an uptrend is when the 20ema is rising or whatever. Whatever helps you get in on the trends.
You can have higher highs and lower lows like you mentioned. Nothing wrong with that. What exactly are you trying to do?
As the leopard said, the high of the candle is the high. Is this not self-explanatory? Average of the high and low would be the middle.
wait...
Suppose that I'm looking for a up trend.
For this I need to find a low point in the graph and then a higher more recent low point and the same for high points.
(this is what I learned).
So if I look at the graph composed of high values of the candlesticks I might get a different result than the one I'd get by looking at the low values of the candlesticks.
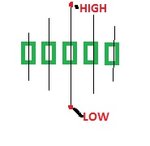
In the picture I attached - if you use the "high" values you'll get a high point but if you use the "low" values, you'll get a low point.
so which is it?
This is why I understood I should use a value which somehow represents the candlestick and it doesn't really matter how.
Did I get it right?
Attachments
Last edited:
wait...
Suppose that I'm looking for a up trend.
For this I need to find a low point in the graph and then a higher more recent low point and the same for high points.
(this is what I learned).
So if I look at the graph composed of high values of the candlesticks I might get a different result than the one I'd get by looking at the low values of the candlesticks.
In the picture I attached - if you use the "high" values you'll get a high point but if you use the "low" values, you'll get a low point.
so which is it?
This is why I understood I should use a value which somehow represents the candlestick and it doesn't really matter how.
Did I get it right?
You have correctly identified the high and low. I still have no idea what you're trying to do though.
I'm not talking about the *candlestick*'s high and low. I looking at the overall graph in order to find the local minimas or local maximas so I can identify the trends.
In my picture the middle candlestick can be considered a local maxima or a local minima, depends on which values of the candlestick (only high values or only low values) you use to build your graph.
It can't be both, right? so which one is it? :/
In my picture the middle candlestick can be considered a local maxima or a local minima, depends on which values of the candlestick (only high values or only low values) you use to build your graph.
It can't be both, right? so which one is it? :/
neil
Legendary member
- Messages
- 5,169
- Likes
- 754
Ok, so I need to look at the high and low values of the candlesticks in order to identify the trends.
But what happens if I see a case which is composed of segments like in my picture? It will have higher highs and lower lows at the same time!
should I just ignore it because it tells us nothing?
The Leopard
Experienced member
- Messages
- 1,877
- Likes
- 1,021
I think there is some confusion here. It seems that the original poster and the other posters are talking about two different things.
Shakone
Senior member
- Messages
- 2,460
- Likes
- 665
Still a bit confused with what you're trying to do tradido, so apologies if this isn't answering your question.
An example of a local high could be identified as follows:
Look at any 3 bars, if the middle bar has a higher high than either bar surrounding it, then you have a local high.
An example of a local high could be identified as follows:
Look at any 3 bars, if the middle bar has a higher high than either bar surrounding it, then you have a local high.
Still a bit confused with what you're trying to do tradido, so apologies if this isn't answering your question.
An example of a local high could be identified as follows:
Look at any 3 bars, if the middle bar has a higher high than either bar surrounding it, then you have a local high.
right, but the middle bar also has a lower low than either bar surrounding it, then I have a local low in the same bar.
How am i supposed to use it? as a local high or a local low?
Since the trends I'm finding are determined by the local lows and local highs I find, I may find different trends by looking at the graph of the high values or looking at the graph of the low values.
neil
Legendary member
- Messages
- 5,169
- Likes
- 754
Ok, so I need to look at the high and low values of the candlesticks in order to identify the trends.
But what happens if I see a case which is composed of segments like in my picture? It will have higher highs and lower lows at the same time!
should I just ignore it because it tells us nothing?
Ignore it and go for a Big Mac with Large Fries
Shakone
Senior member
- Messages
- 2,460
- Likes
- 665
right, but the middle bar also has a lower low than either bar surrounding it, then I have a local low in the same bar.
How am i supposed to use it? as a local high or a local low?
Since the trends I'm finding are determined by the local lows and local highs I find, I may find different trends by looking at the graph of the high values or looking at the graph of the low values.
That's fine. You have a local low and a local high. Then you'll have another one further on in the chart. This local high of this point further on, might be higher than the previous one, and if it also has a local low, this might be higher than the previous one. Then you could say the trend was up, higher highs and higher lows.
rsh01
Experienced member
- Messages
- 1,184
- Likes
- 299
so which is it?
hi trad,
what has price done in the middle bar? its broken new highs (or new lows - whichever was first), rejected them, and gone for new lows, and rejected them. what does the next bar do...it doesn't challenge the prev bars high/lows.....so is price confused like you? yes.
this 'confusion' of the market is a common occurrence and when identified can be used to trade breakouts / trade reversals etc. i wont go into anymore detail as i prob have misunderstood your query. if you get bored of this, please go to the dennis richards thread in the foyer for relief.
i will point out though that the chart example you posted represents a diamond formation.
happy trading.