Thought you might be interested in the attached chart which shows weekly and daily support/resistance levels for CL.1 front month at NYMEX. The mathematics is explained in more detail in the FX forum thread called
"Predicting future FX support and resistance levels using mathematics"
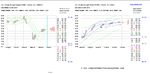
The attached chart shows weekly support and resistance levels and the long term trend channel in green (top middle and bottom) to the left. The chart shows daily support and resistance levels to the right and the short term trend channel in blue (top, middle and bottom). The long term trend channel is overlaid on the short term trend channel on the right.
About 25 February this year the top of the short term trend channel collided with the middle of the long term trend channel.
Today the short term trend channel is trying to break back into the long term trend channel.
In the long term, CL.1 will never become bullish until it finds support on the middle of the long term trend channel which is currently at $38.02.
Until the price can find support on the middle of the short term trend channel currently at $25.00 and the short term trend channel has broken back inside the long term trend channel, then CL.1 will continue to fall.
Plot the coloured levels on your chart and watch the price action move around them.
I will post occasional charts in the future.
gka

"Predicting future FX support and resistance levels using mathematics"
The attached chart shows weekly support and resistance levels and the long term trend channel in green (top middle and bottom) to the left. The chart shows daily support and resistance levels to the right and the short term trend channel in blue (top, middle and bottom). The long term trend channel is overlaid on the short term trend channel on the right.
About 25 February this year the top of the short term trend channel collided with the middle of the long term trend channel.
Today the short term trend channel is trying to break back into the long term trend channel.
In the long term, CL.1 will never become bullish until it finds support on the middle of the long term trend channel which is currently at $38.02.
Until the price can find support on the middle of the short term trend channel currently at $25.00 and the short term trend channel has broken back inside the long term trend channel, then CL.1 will continue to fall.
Plot the coloured levels on your chart and watch the price action move around them.
I will post occasional charts in the future.
gka