Build Neural Network Indicator in MT4 using Neuroshell

Hi Arry.
You asked for a post to show how to convert C source to a DLL callable from MT4. Here is one way:
Assuming that you have modified the C Source so that the function to be called is something like:

#define WIN32_LEAN_AND_MEAN
#include <math.h>
#include <windows.h>
__declspec (dllexport) void __stdcall BN561(double * inputs, double * outputs) {...}

Using Microsoft Visual Studio 8.0 or 9.0
1. Set up a folder
2. Copy the c source into the folder
3. Make a .def file to refer to the net function

LIBRARY "XYZ"
EXPORTS
BN561

4. Start up VC and set up a BLANK new project ( DLL)
5. Import the properties from the file attached (tools/import)
6. Modify project properties (linker) to add the def file
7. Load c source into project
8. Build debug and release DLL's

You can test the DLL call using the attached dll function viewer. If you did everything right, when you drag the DLL onto the function viewer, the available functions will be shown in the window. If your function shows (name only, no screwy symbols) then the DLL can be called from MT4. If you get screwy symbols, then something is wrong. Let me know how you do. :D
 

Attachments

  • dllexp.zip
    41.6 KB · Views: 200
  • Exported-Settings.zip
    40.4 KB · Views: 205
Hi Fralo,

Thank you for the link for tick data, by the way it preferable for me to use my broker data, the charts showing discrepancy between different broker due to;
- different server time, check the high low values and the tine when it happened
- different spread and OHLC data as well
In Hourly chart, Dukascopy at 13:00 1 April O 1424.32 H 1424.32 L 1412.62 C 1414.77
In Hourly chart, FXDD at 16:00 1 April O 1424.35 H 1424.35 L 1412.7 C 1414.78
They have 3 hour difference server time, open/high 3 pips, low 8 pips, Close 1 pip.
Those OHLC data can have different indicator value as well as prediction result from NN.

I will answer your PM

Thanks
I understand the problems. Interesting that there is that much difference between Dukas and FXDD. Dukas is an ECN with large liquidity, so I might be suspicious of FXDD. They may have been stop hunting at those extremes?:)

If you follow eareview method to download and convert tick data for MT4 tests, you can set up any GMT offset that you desire when you generate the HST and FXT files for MT4. The advantage of DukasCopy is that it does not have gaps and as many spikes as most brokers. It is very clean data, and very much like live data from a good broker. Another advantage if you use the Birts patch script is that you can control the spread, etc used for testing. You will have true tick data in the FXT file instead of the simulated tick data that the Russians generate using M1 data hst files. Look at the tests run by Birt on his site and you will see the advantage of using good data for testing...probably also for training a net since there are no gaps.
 
Hi Fralo,

I succeed to create dll from your sample PT3.zip, unfortunately I have a problem when creating my own indicator.

I will tell my own problem afterwards.
 
Last edited:
Hi Fralo,

I get error 127 when calling up my own dll, see the detail in attachment.

Thank you in advance if you can find the source of problem.(y)
 

Attachments

  • Problem creating dll-error 127.pdf
    437.3 KB · Views: 368
Last edited:
Hi Stan,

Finally I found what are the cause of the error, i.e. I put not the same exported procedure in cpp code and def file, that is why the procedure can't be called.

Thank you for your valuable time to evaluate the problem..
 
My main principle - simplicity of design of the system (neural network). User-level work in Neuroshell allows us to develop top-notch system. In the development of HH important qualitative choice and the total correlation inputs.
 

Attachments

  • WORK.JPG
    WORK.JPG
    96.3 KB · Views: 723
A simple system based on the RSI predicted at 1 forward in the period range from 5-10
 

Attachments

  • WORK2.JPG
    WORK2.JPG
    149.2 KB · Views: 750
Mr. Future,

To identify whether a trading/prediction strategy is suitable, can you show the statistic values reported in NSDT, such as % win, required account size, spread/commission? What are the inputs that you are using?
Most of time the result may be change after correcting above parameters.

Out from the subject, I have found a trick to know what are the threshold values of prediction strategy. Most of Trading strategy will have the following output:
- Generated entry/exit signals: Pred> Long entry threshold, Pred< Long entry threshold, Pred< Short entry threshold, Pred> Short entry threshold, Actual, actual signal, prediction and prediction signal.
The problem is we do not know what are exactly the threshold values used to generate trade signals using predicted values.

This ebook will explain to you how to find this threshold value, the tool you need only NSDT and Excel, or you can use also genehunter or any other Genetic Algorithm addin in excel to get sophisticated result.

The file is password protected by password, please PM me to get the password, I will give to the people who involve actively and support in this thread.

Thank you
 

Attachments

  • FIND PREDICTION STRATEGY TRESHOLD.pdf
    315.5 KB · Views: 572
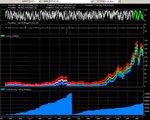
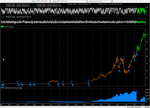
I am verifying mr. future last picture:
- The top chart prediction OOS (green line) displayed from mid 2007, it should be a correct OOS.
- The 2nd chart prediction 1 bar %Change in Open #2, showing the optimization has been done in all over chart period, no green line...hence no OOS
- The 3rd chart showing the trading strategy OOS, started from about March 2001. If this trading strategy made based on the prediction signals from above chart prediction then I suspicious that the OOS result is not correct, why:
- There is no OOS especially from 2nd chart, if this is used as input hence trading strategy is optimized all over chart.
- The correct OOS from trading strategy shall be started from mid 2007 and removing 2nd chart prediction signal.
- Trading strategy will find the best input, then probably only using 2nd chart prediction signal.

I am not sure what are the inputs have been used to create trading strategy, but here I made the similar but not same result.
 

Attachments

  • aapl bzl.png
    aapl bzl.png
    35.1 KB · Views: 777
  • aapl bzl summary.png
    aapl bzl summary.png
    45.8 KB · Views: 588
The idea is that neural networks as input to use the average (also normalized) predicted values ​​of the indicators.
To find the optimal parameters predicted by the indicators I use it lead value.
 
Hi all,

Following my friend advice, I have closed myfxbook for public viewing, I will open it when it is necessary. For me it is enough to evaluate myself, just to avoid any negative impact.

Trading with believe is better ....

My current conclusion: Trading with neural network prediction can produce a very good profitable trade, only if you can find the correct input and output for your net..

From now own, I will fully involve for developing my system ..thanks for the one who has supporting this thread..

Happy trading...
 
Last edited:
I’m gonna miss this incredible thread...

Thanks again Arryex for sharing all this.

Best of luck….
 
Thanks Superluz..don't worry please PM me I if you need something ..I am still willing to share the knowledge and posting as well but please do not asking for the private trading result..
 
отдыхаю... и за одно хочу возбудить интерес к ненасущной теме.
а если серьезно то это скрин с форума Alpari с одноименной русскоязычной ветки
http://forum.alpari.ru/showthread.php?t=29694&page=569
как видимо звезды NeuroShell бывают и там... :smart:
 
Top