Одна из моих идей заключается в том что входной ряд при моделировании составлять из предсказанных значений показателей. Как мы видим усредненные показатели которые имеют даже невысокую исходную корреляцию с выходящим значением но предсказанные на 1 значение вперед дают хорошие результаты. Эта зависимость характерна для многих индикаторов образованных из одного ценового ряда и с невысоким периодом усреднения. В этом можно убедиться подавая на вход опережающие индикаторы Lead.
You are using an out of date browser. It may not display this or other websites correctly.
You should upgrade or use an alternative browser.
You should upgrade or use an alternative browser.
Build Neural Network Indicator in MT4 using Neuroshell
Mr. Future,
To identify whether a trading/prediction strategy is suitable, can you show the statistic values reported in NSDT, such as % win, required account size, spread/commission? What are the inputs that you are using?
Most of time the result may be change after correcting above parameters.
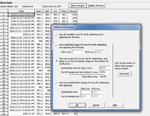
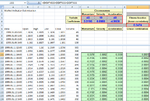
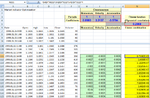
Out from the subject, I have found a trick to know what are the threshold values of prediction strategy. Most of Trading strategy will have the following output:
- Generated entry/exit signals: Pred> Long entry threshold, Pred< Long entry threshold, Pred< Short entry threshold, Pred> Short entry threshold, Actual, actual signal, prediction and prediction signal.
The problem is we do not know what are exactly the threshold values used to generate trade signals using predicted values.
This ebook will explain to you how to find this threshold value, the tool you need only NSDT and Excel, or you can use also genehunter or any other Genetic Algorithm addin in excel to get sophisticated result.
The file is password protected by password, please PM me to get the password, I will give to the people who involve actively and support in this thread.
Thank you
hi arryex, nice move about the threshold, but what is the different between it and the prediction details?

also I would like to know when you using chaoshunter did you check all the operations? did you check chaos input? and how you set the formula properties usually
Hi Nixjoe,
If you are using all indicators input in NSDT and make prediction with NSDT, there should give the almost same result but sometime has small different,probably due to the precision point that are used in excel. My experience, using genehunter most of time I have different 1 value (not 100% match).
I use this threshold searching technique when I am using indicators input from MT4 (which are not available or have different value with NSDT indicators), and target prediction based on optimum signal (created manually or from NSDT).
For chaos hunter, as long as all inputs used to make prediction are available in MT4 or NSDT and both of them have same values (such as OHLC values or some indicators), then I apply the prediction value either in MT4 or NSDT. In NSDT using external program and library calls to take the trained net from CH (model file).
While in MT4 you can use model file using dll wrapper facility (part of CH distribution) or put in manually the formula into mq4 (but you need to convert formula made from CH into mq4 code).
I using the same data range for optimization in CH and when implemented on NSDT or CH for OOS test (usually 20% last data).
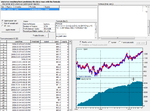
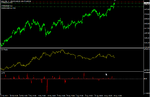
Here I attach the sample pictures, if I am lucky to put correct formula in mq4 code then the result between NSDT and MT4 shall be same. I expense 2 weeks to create mq4 code ..its hard but nice to see if the coding is successful and the calculation in NSDT and MT4 are giving same values.😀
The next target is to create trading signal based on this formula (into an EA)..
Cheers
If you are using all indicators input in NSDT and make prediction with NSDT, there should give the almost same result but sometime has small different,probably due to the precision point that are used in excel. My experience, using genehunter most of time I have different 1 value (not 100% match).
I use this threshold searching technique when I am using indicators input from MT4 (which are not available or have different value with NSDT indicators), and target prediction based on optimum signal (created manually or from NSDT).
For chaos hunter, as long as all inputs used to make prediction are available in MT4 or NSDT and both of them have same values (such as OHLC values or some indicators), then I apply the prediction value either in MT4 or NSDT. In NSDT using external program and library calls to take the trained net from CH (model file).
While in MT4 you can use model file using dll wrapper facility (part of CH distribution) or put in manually the formula into mq4 (but you need to convert formula made from CH into mq4 code).
I using the same data range for optimization in CH and when implemented on NSDT or CH for OOS test (usually 20% last data).
Here I attach the sample pictures, if I am lucky to put correct formula in mq4 code then the result between NSDT and MT4 shall be same. I expense 2 weeks to create mq4 code ..its hard but nice to see if the coding is successful and the calculation in NSDT and MT4 are giving same values.😀
The next target is to create trading signal based on this formula (into an EA)..
Cheers
Attachments
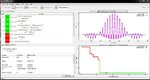
I like to see what is the main advantage of CH, I just download demo of Neurosolutions 6 for Fuzzy canfis problem to make prediction for sinc equation sin(x)*sin👍/xy.
This result can't be generalized..just for fun...but CH can provide precise solution if providing with the proper inputs.
Here I attached the result and the original data..you may try with your own neural network software to predict sinc function.
This result can't be generalized..just for fun...but CH can provide precise solution if providing with the proper inputs.
Here I attached the result and the original data..you may try with your own neural network software to predict sinc function.
Attachments
Hi Nixjoe
My intention is only for implementing CH formula in MT4, so I do not care for the OOS test..just for fun:cheesy:
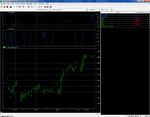
When using chwrapper version, we can show the total equity (use output type =3).
But when implemented in NSDT used for silver ..surprised..😀
chaosvar will be included on your formula if you tick "Use formula output as input on the next iteration" it requires several previous bars prior showing the value..I do not know yet how to use and implement this in mq4 that's why I am not use it.
Let me check to verify RSI prediction with CH and revert to you if I am succeed.
My intention is only for implementing CH formula in MT4, so I do not care for the OOS test..just for fun:cheesy:
When using chwrapper version, we can show the total equity (use output type =3).
But when implemented in NSDT used for silver ..surprised..😀
chaosvar will be included on your formula if you tick "Use formula output as input on the next iteration" it requires several previous bars prior showing the value..I do not know yet how to use and implement this in mq4 that's why I am not use it.
Let me check to verify RSI prediction with CH and revert to you if I am succeed.
wow,arryex your ch model is so cool,how about oos? , Maybe I should devote more time into CH. CH 's chaos input (chaos variable) is not as good as i think, once I make it to predict the typical 14-day RSI formula , it just simply can not work it out.
Attachments
Hi Superluz,
Nice software even beta ...and free..👍👍
Thanks
Nice software even beta ...and free..👍👍
Thanks
After few seconds with Eureqa 🙂
Then one with size 12 it's really nice...
Hi Superluz,
I tried eureqa..utilize eureqa server for multicore optimization.. and getting same final result...:cheesy:
Averyone can download eureqa from http://ccsl.mae.cornell.edu/eureqa
Thanks
I tried eureqa..utilize eureqa server for multicore optimization.. and getting same final result...:cheesy:
Averyone can download eureqa from http://ccsl.mae.cornell.edu/eureqa
Thanks
Attachments
Nice!
Another great and powerfull software similar to CH.
http://www.adaptrade.com/
But only for easylanguage....no mt4 support. 🙁
Another great and powerfull software similar to CH.
http://www.adaptrade.com/
But only for easylanguage....no mt4 support. 🙁
Then we need to know how to convert easylanguage code into mq4.
I am not sure if it is easy..
I am not sure if it is easy..
Nice!
Another great and powerfull software similar to CH.
http://www.adaptrade.com/
But only for easylanguage....no mt4 support. 🙁
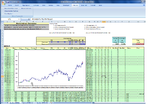
I just play with genetic optimization for a mechanical trading strategy (stock BMRI.JK).
The trade entry are based on a trading rules RSI crossover threshold, MACD cross over, and close price cross over Bollinger band, using GA to find optimum parameters to generate most profitable trade.
The difficulty is to formulate technical indicators in excel directly from raw price (It is not work if using indicator add-in such as analyzerxl or tradercode).
I think this is similar trick used within adaptrade.
Attachments
I just play with genetic optimization for a mechanical trading strategy (stock BMRI.JK).
The trade entry are based on a trading rules RSI crossover threshold, MACD cross over, and close price cross over Bollinger band, using GA to find optimum parameters to generate most profitable trade.
The difficulty is to formulate technical indicators in excel directly from raw price (It is not work if using indicator add-in such as analyzerxl or tradercode).
I think this is similar trick used within adaptrade.
are you evaluate simple system with excel and genehunter?! is it complex?😱
With CH we can define our own system, I am not sure what simple system you mean. For me the complex thing is to implement the technical indicator formula within excel.
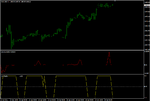
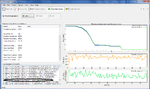
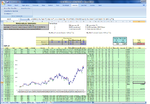
We can create also a new indicator as linear or polynomial combination from existing indicators. Here is the sample how we can create a new indicator based on momentum, velocity and acceleration, I create a linear combination (a*momentum+b*velocity+c*acceleration) and polynomial (a*momentum^2+b*velocity^3+c*acceleration^4), I made it based on existing sample from CH. We can make any other combination, it is based on highest correlation with the next Close price.
Then we can put the optimum indicator into NN trading system if you wish and implement it in MT4 or NSDT..
Attachments
With CH we can define our own system, I am not sure what simple system you mean. For me the complex thing is to implement the technical indicator formula within excel.
We can create also a new indicator as linear or polynomial combination from existing indicators. Here is the sample how we can create a new indicator based on momentum, velocity and acceleration, I create a linear combination (a*momentum+b*velocity+c*acceleration) and polynomial (a*momentum^2+b*velocity^3+c*acceleration^4), I made it based on existing sample from CH. We can make any other combination, it is based on highest correlation with the next Close price.
Then we can put the optimum indicator into NN trading system if you wish and implement it in MT4 or NSDT..
Thank you very much for very detail explains for me .now I got your point and understand your chart now. really appreciate . your thread really motivate me to lanch CH and bake some systems 😆
Yes, but I’m currently testing few ideas based on the following message which I have found on the Eureqa group:
“Here are a couple ideas I had. I think you can do what you want, but it
requires some initial setup outside of Eureqa:
(1) Do binary classification:
Perhaps you can preprocess on the data, calculating when it would have been
a good idea to buy or sell the stock. In other words, create a new variable
of zeros and ones, with ones for rows where it would be optimal to have this
stock, and zero otherwise. Then try to model this value as a binary value,
like "buy = logistic( f(x,y) )". See:
http://blog.eureqa.com/2010/06/modeling-binary-yesno-output.html
The f( ) that Eureqa looks for then becomes a strength or probability toward
"buy" being one, which implements a strategy based on your preprocessing.
You could also do the same for detecting other qualitative events, as along
as you can setup a variable of 0's and 1's for it.
(2) Find a scoring function:
Another idea is to search for a scoring function, where the search relation
takes inputs for two stocks (or the same stock at different times) and
returns which one is "better". For example, a search relation like
"buy_x = logistic( f(x1,x2,x3) - f(y1,y2,y3) )"
Here, each row in the data contains variables for two stocks, x:{x1,x2,x3}
and y:{y1,y2,y3}, plus a variable "buy_x" that you've created that equals 1
when the stock x would be preferred over y, and 0 otherwise. Then the
"f(...)" that Eureqa searches for would effectively be a scoring function
that has high value when the input stock is good. You could then use a
solution f(...) to implement a trading strategy by ranking stocks based on
their f(...) value.
This method also requires preprocessing to create a "buy_x" variable and
setup of the data into pairs of stocks. Again, you could replace "buy_x"
with any other trait, such as stock x showing some trait more or stronger
than stock y.
“
Similar threads
- Replies
- 24
- Views
- 34K
- Replies
- 5
- Views
- 4K