Build Neural Network Indicator in MT4 using Neuroshell

Ok, I will give you tomorrow the sample code created by NS2 and complete step that I have done and the problems,

I created the dll already but when I call it, mt4 can not call the procedure that I defined. There are some confusing steps also in Visual C++ (Win32 console, DLL, or MFC, etc), may be I forget also to create include file (mqh) when the dll file has been copied to libraries.

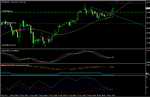
Right now I am still busy on checking my open trade.

Thanks in advance
 
My indicators showing that XAGUSD still going uptrend, aaNeuroMACD seems giving late signal, but aaNeuroRSI giving earlier signal and aaNeurotrend still consistent for uptrend.

The breakout trend line also confirm the aaNeuroRSI entry, even aaNeuroMACD still downside.
 

Attachments

  • XAGUSD 30-Mar-11.png
    XAGUSD 30-Mar-11.png
    36.3 KB · Views: 1,342
Amit,

My current progress, still developing dll file from c code created by NS2 using visual studio(not succeed yet :confused:).

Currently I just made indicator based on trained net from chaoshunter and aitrilogy..:D

Arry,

I strictly believe in never optimising parameters . Optimisation is like axing owns feet. However sensible optimisation is acceptable like the middle bollinger band average can be optimised between 18-20 with steps of 1 .. but using a value between 0-20 doesnt make sense to me ( this is not related to your posted tthread trade)

Coming to chaos hunter i was intrigued so much intially but when i foudn that it extracts formula from patterns and ( possibly overfits ) i lost my faith in it.

In short if you run chaos hunter on set of data where market dynamics could change in future, the problem.

Any comments on this ?`
 
Supremegizmo,

Right now I do not care what about the result of prediction made by any software, my objective is to implement them as my trading tools, i.e. showing the result on MT4..further evaluation for the result can be done progressively..

The key point which always I mentioned is to find the pattern not the price it self, if you can predict the future percent change based on momentum of price most probable this can be implemented in all condition.. Compare if you made prediction on bollinger band based on previous moving average..both input and output will always depend on the price range, hence even you overfit in one data range it may not applicable in other range (higher or lower range).

Hence I try to overfit into pattern not into the price. I am not sure this is my correct choice..but so far still good...

Here I show you how I did the pattern recognition for a simple data.
- The training data based on the chart pattern (see small graph), I have coordinate values as 10 inputs and 5 chart pattern type as output
- I train with NS2, the statistic is displayed
- Testing result

Here on the testing result, event each value of data are changed, as long as the pattern is consistent the trained net will also display the correct result.

Probably we can make also higher dimension pattern (with 3 dimensional data) I think this is what has been implemented in some application such as face recognition

Happy trading...
 

Attachments

  • Sample pattern data.png
    Sample pattern data.png
    168.5 KB · Views: 581
  • Sample pattern training statistic.png
    Sample pattern training statistic.png
    164.5 KB · Views: 567
  • Sample pattern testing.png
    Sample pattern testing.png
    170 KB · Views: 520
Last edited:
Here the training and testing of previous chart patterns using NSpredictor and Chaos Hunter.

The benefit of Chaos hunter is we can put directly the result as formula so no more a black box.

The next step is to find the way how to implement this chart pattern recognition in the real chart?
 

Attachments

  • NSPredictor Firing net.png
    NSPredictor Firing net.png
    264 KB · Views: 503
  • NSPredictor train result.png
    NSPredictor train result.png
    79.4 KB · Views: 493
  • CH firing net using formula.png
    CH firing net using formula.png
    226.6 KB · Views: 533
  • CH firing net using runtime.png
    CH firing net using runtime.png
    278.4 KB · Views: 482
  • CH training.png
    CH training.png
    96.5 KB · Views: 541
Hi,

I am really enjoying the benefit using NSpredictor and NSDT 6, the combination of these software can reach the ideal prediction.

The objective is to create macd prediction:
- create network training data (more than 17000 bars of data, 60 minutes XAUUSD)
- Inputs: momentum, price momentum indicators (60 m) and its higher time frame (4 hrs)
- output: 10 bar future of momentum EMA
- Use genetic algorithm (warm and genehunter) optimization in NSpredictor
- import the trained net into nsdt
- create prediction/trading strategy based on trained net
Seem during retrain in NSDT I get overheating on my CPU (all cores are working hard), but the result is good to be considered (almost 0.99 Rsquared and 99% correct sign).

Need to test further on more out of sample data..

cheers

Hi Arry,

Nearly a week I worked in macd prediction as your suggestion. But its Rsqr or % correct only around 0.15 & 60% :confused:. My setup like:
- 60min EURUSD (10.000rows)
- Net:
- Input: few mix-up or all:
. Momentum(1), Momentum(1) lag1, Momentum(1) lag2,.... lag9
. Momentum(4), Momentum(4) lag1, Momentum(4) lag2,.... lag9
. Momentum(10), Momentum(10) lag1, Momentum(10) lag2,.... lag9
. EMA(10), EMA(10) lag1....
. Delta EMA(10)
- Output: 1 of
. (EMA(10) 10bar in future - EMA(10) present)
. (EMA(10) 1bar in future - EMA(10) present)

Not any setup come near to 70%. My batch progam is still running and continue write out results but not any look good.
Would you please show me did I wrong in anything?

Thanks & Best regards.
 
Hi Akuma,

Which software you are using? can you post you data in csv, if it is in NSDT chart you can post the chart with saved data.

Let me analyze it afterward.

Thank You & Best regarsd
 
Hi Akuma,

Which software you are using? can you post you data in csv, if it is in NSDT chart you can post the chart with saved data.

Let me analyze it afterward.

Thank You & Best regarsd

Arry,

I use build my program use ANN core to to train net.
Attached file is data i used to training. The result are 0.22 Rsqr and 64% correct

Thanks very much!

P/S: your trade look sooo good. Congrat! (y)
 

Attachments

  • XAUUSD 1 Hour.csv
    597.5 KB · Views: 383
Akuma,

As my suggestion to increase your result Rsqrd try to use the trained net result as new input.

You can add Close-EMA(10) as additional input to predict <Actual(EMA(10)(t+10) - EMA(10)>, using this input you will get at least 0.24 Rsqrd.

My benefit is I can see what is the formula for the better input from one of my software then I can add this new formula as new input. Do it repeatedly in order getting better prediction.

See my result during training and Rsqrd values jus using momentum EMA and the new result after adding new indicator. The Rsqrd value is increasing to 0.27. This is what mentioned earlier to use the trained net for new net.

Hope you can get a better result.
 

Attachments

  • EMA10 Rsqrd-2.png
    EMA10 Rsqrd-2.png
    47 KB · Views: 437
  • EMA10 training 2.png
    EMA10 training 2.png
    58.9 KB · Views: 552
  • EMA10 Rsqrd-1.png
    EMA10 Rsqrd-1.png
    46 KB · Views: 413
  • EMA10 training-1.png
    EMA10 training-1.png
    46.6 KB · Views: 427
Hi Akuma,

After continuing searching the good inputs, here I found which inputs can give Rsqrd 0.93, I made using NSPredictor and NS2.

If I put both trained net as indicator input for prediction in NSDT, the result is attached, I am still using OOS test for the last 873 bars as I did during the training the net in NSPred and NS2.

Hope you can get the same result too...it is very nice prediction, let see the real OOS after today..

Best regards
 

Attachments

  • Training result XAUUS model 2b In NS2.png
    Training result XAUUS model 2b In NS2.png
    119.6 KB · Views: 561
  • Training result XAUUS model 2b NSPred.png
    Training result XAUUS model 2b NSPred.png
    92.9 KB · Views: 574
  • NSDT trade result.png
    NSDT trade result.png
    219.8 KB · Views: 626
Hi Akuma,

After continuing searching the good inputs, here I found which inputs can give Rsqrd 0.93, I made using NSPredictor and NS2.

If I put both trained net as indicator input for prediction in NSDT, the result is attached, I am still using OOS test for the last 873 bars as I did during the training the net in NSPred and NS2.

Hope you can get the same result too...it is very nice prediction, let see the real OOS after today..

Best regards

That's amazing, Arry :clap:

I buy NS2 now, look like I really need professional software. :eek:
Anyway, there's something confusing me:
1/ Do You use only my data or have other data? I want to learn what I am missing.
2/ Did You use some filter in data? Or just cut it short?
3/ From 0.24 to 0.93 is like magic, which is your network architecture, I think this make the different.

I'm really grateful if you may send back me the data and net for my evaluation.
Thank you and Best Regards.
 
Hi Akuma,

The key is selection of inputs, I removed all which are really make noise, you can compare the indicator (your target) with your original inputs, they are very noisy while your output is quite smooth.
1. I use the original data, I checked there was no difference values with mine then I upload into NSDT to see the chart. I include originally some new inputs such Open, high, Low, Close then DP momentum of EMA (not momentum of close).
2. I did not make any filtering, I remove missing data in input (at beginning) and output (at the last) otherwise your net will be disturbed.
3. In NS2 I use ward net, with turboprof, while NSPred and Chas Hunter the architecture are unknown.

Here I attached my data, all from raw data except for the last input (NSPred,NS2,NSPred 2b1) which are created from trained net. You can build the same way to put all inputs (except above last three) to build new prediction net then use the result to create new nets. I made three deep NN training to get improvement..:smart:

Sorry I could not giving you the trained net resulted ..you need to have the software to run them.

Best regards
 

Attachments

  • xauusd 2c.csv
    783.7 KB · Views: 358
Hi Akuma,

The key is selection of inputs, I removed all which are really make noise, you can compare the indicator (your target) with your original inputs, they are very noisy while your output is quite smooth.
1. I use the original data, I checked there was no difference values with mine then I upload into NSDT to see the chart. I include originally some new inputs such Open, high, Low, Close then DP momentum of EMA (not momentum of close).
2. I did not make any filtering, I remove missing data in input (at beginning) and output (at the last) otherwise your net will be disturbed.
3. In NS2 I use ward net, with turboprof, while NSPred and Chas Hunter the architecture are unknown.

Here I attached my data, all from raw data except for the last input (NSPred,NS2,NSPred 2b1) which are created from trained net. You can build the same way to put all inputs (except above last three) to build new prediction net then use the result to create new nets. I made three deep NN training to get improvement..:smart:

Sorry I could not giving you the trained net resulted ..you need to have the software to run them.

Best regards

That's really help me out Arry, thank you.
Will post result after study your this post.
 
arryex; said:
Hi Akuma,

The key is selection of inputs, I removed all which are really make noise, you can compare the indicator (your target) with your original inputs, they are very noisy while your output is quite smooth.
1. I use the original data, I checked there was no difference values with mine then I upload into NSDT to see the chart. I include originally some new inputs such Open, high, Low, Close then DP momentum of EMA (not momentum of close).
2. I did not make any filtering, I remove missing data in input (at beginning) and output (at the last) otherwise your net will be disturbed.
3. In NS2 I use ward net, with turboprof, while NSPred and Chas Hunter the architecture are unknown.

Here I attached my data, all from raw data except for the last input (NSPred,NS2,NSPred 2b1) which are created from trained net. You can build the same way to put all inputs (except above last three) to build new prediction net then use the result to create new nets. I made three deep NN training to get improvement..:smart:

Sorry I could not giving you the trained net resulted ..you need to have the software to run them.

Best regards

Arry,

I manage to have the net .95 Rsqr :clap: but only IF (big If) i use you trained net result!!! :(. If i use my inputs alone, so far 0.25.
Could you please tell me what inputs use in your first net in NS2? Or your data file? My next target 0.4, but it still far away.
May I have your YID? My is [email protected]. I really want to chat with you someday.

Best regards.
 
Akuma,

Previously I have limited my self to select inputs for my net, but now I add my intuition to include some new inputs for a discovery:idea:. The rule is simple try it, if getting better, put the result as new input otherwise try a new one:!:.

In NS2 there is facility to find optimal indicator which giving high correlation with output (check the custom indicator), in the beginning I put all indicators available, using GMDH/polynomial Net will inform which input giving high correlation, this GMDH will left out which input that not useful to predict output. I did not believe in the beginning that I have 16 nets architecture that I can play with, and I can select also which transfer functions:-0.

if you have NSDT you can do the same way but the target prediction is not to get higher Rsqrd, try first high correlation. So for me, searching the good inputs become art rather than science:).

For inputs try some other indicators such as CCI, stochastic, or whatever indicator you have (NSDT have more 800 indicators!!!)..Nobody prevent you to use them, If I give you my result, this may not encourage you to find them, probably your inputs can give better result than mine. why not?:smart:

I received so many queries in order can chat with me, due to my limited time I could not fulfill your request. I will send you an email to your address. Now I am quite busy doing chart pattern recognition study.. so be patient;)

Best regards
 
Hi Akuma,

Please check your email ..may be it come to your spam folder..

Thank you & regards
 
I just had time to read this thread and get caught up again. There was a discussion of the data to use, and if the tests were data sensitive. You can look here http://eareview.net/tick-data for a good discussion of the use of data and a method to get very consistent results using data from DukasCopy. It seems that to get consistent Strategy Tester results related to real data one should use tick data. Incidentally, there is a side advantage to tick data from DukasCopy..it includes what might be called "real" tick volume. If you are trying to estimate trader sentiment, this volume is a lot better than the screwy tick volume from most brokers.

Another comment..MatLab has just announced a toolkit to run matlab on parallel cpu's, so you can get significant speedup if you have a GPU or even just multi core CPU.

Arry, I have PM'd you.
 
Hi Fralo,

Thank you for the link for tick data, by the way it preferable for me to use my broker data, the charts showing discrepancy between different broker due to;
- different server time, check the high low values and the tine when it happened
- different spread and OHLC data as well
In Hourly chart, Dukascopy at 13:00 1 April O 1424.32 H 1424.32 L 1412.62 C 1414.77
In Hourly chart, FXDD at 16:00 1 April O 1424.35 H 1424.35 L 1412.7 C 1414.78
They have 3 hour difference server time, open/high 3 pips, low 8 pips, Close 1 pip.
Those OHLC data can have different indicator value as well as prediction result from NN.

I will answer your PM

Thanks
 
Sorry missing attachment
 

Attachments

  • Chart_XAU_USD_Hourly_snapshot-Dukas.png
    Chart_XAU_USD_Hourly_snapshot-Dukas.png
    25.2 KB · Views: 457
  • Chart_XAU_USD_Hourly_snapshot-MT4.png
    Chart_XAU_USD_Hourly_snapshot-MT4.png
    30.3 KB · Views: 503
Top