You are using an out of date browser. It may not display this or other websites correctly.
You should upgrade or use an alternative browser.
You should upgrade or use an alternative browser.

amit1986
Experienced member
- Messages
- 1,100
- Likes
- 66
Hi Amit,
Do you use the QQQQ, NQ #F and the SPY, ES #F? Can you explain if the NQ and ES are better than the QQQQ and SPY? Any advantage?
Thx
Rob
Hi Rob,
Among the few charts I have on one of my screens, there are two charts of the ES and the NQ. I use them to have an overall picture of the market trend on any given day and compare that trend to the strength of the stock I am watching. In the morning to midday, they are running on the 1-minute time frame. Around mid-day to about 2:30pm EST, they are running in 3-minute. For the final hour of trading, I have them on the 5-minute time frame.
Next to those two charts, I have a quote box which shows the percentage change of the QQQQ, S&P 500 Index, Dow Jones Index, Nasdaq 100 Index, along with the Volatility Index (VIX). I would put up charts of those but I don't enough screen space for that (yes, even four 24" screens aren't enough!). But it would also be redundant to have those charts along with the NQ and ES.
Not really sure if there is any advantage to using the QQQQ, SPY, and DIA as a substitute for the ES and NQ. Perhaps one difference could be that the futures are a derivative of the indexes, so traders also have to incorporate that information when they price them. So, their price movements won't be 1-to-1 with the index itself. But that is an almost negligible thought for my case as I only use them to 1) have an idea of the overall market trend; and 2) compare the futures' trends to trends of individual stocks.
Hope it helps,
Amit
amit1986
Experienced member
- Messages
- 1,100
- Likes
- 66
For those trading U.S. stocks on this quiet Friday morning, check out MMI. Look at the intraday 1-minute chart, along with the daily chart and see how high-probability setups work. I took a simple trade based on Mr. Charts' falling candles rule and got 35 cents per share profit out of it.
I will post a chart later when I finish the days trading.
I will post a chart later when I finish the days trading.
amit1986
Experienced member
- Messages
- 1,100
- Likes
- 66
I didn't take the corresponding breakout because the spread has opened too wide for my liking and I feel it could be a trap by the market maker, i.e. not enough momentum. It ticked back up now.
That's the power of reading bid/ask pressure on level 2.
That's the power of reading bid/ask pressure on level 2.
amit1986
Experienced member
- Messages
- 1,100
- Likes
- 66
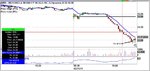
Simple breakdown trade Friday afternoon on MMI. Check out the attached daily chart. For the first time, this stock broke down to all-time lows. That is a good indication to invite a lot of short sellers, especially in a down trending stock that has also formed a triple-bottom on the daily chart. This can also be confirmed by the volume spike in the daily chart.
Furthermore, lots of people who are still holding the stock are now in a loss and are looking to sell. It's highly likely that they will sell once the stock breaks to all time lows. A combination of this and the above make for a high probability trade.
I used the setup as described by Mr Charts on his thread of falling candles. However, once the stock penetrated the whole number, I could see buying pressure building and decided to exit.
Short Entry: 24.31
Exit: 23.9583
Profit: +35 cents per share
Entry on crosshairs; exit as detailed on chart. See broker screenshot for detailed entry/exit information.
Attachments
amit1986
Experienced member
- Messages
- 1,100
- Likes
- 66
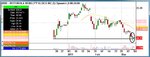
One of many trades today - CW reversal. It had fallen all day almost 10% and was due for a reversal. As soon as I saw bidding pressure building on level 2, I went long, getting filled at 34.3367.
This is a not a stock where a large position size would have been optimal.
I decided to run a trailing stop as the opposite end of the previous candle as proposed by Mr. Charts, on the 5-minute chart, unless strong selling pressure on level 2 told me to get out.
That selling pressure appeared around the 34.70 level and I decided to cover, knowing well the bids could be dropped instantaneously and I could get a bad fill. Exit was pre-mature, but it made for a nice gain on a (tough) swing trade.
Long Entry: 34.3367
Exit: 34.70
Commissions: 1 cent per share
Net profit: 35.33 cents per share
Not an easy trade to manage. I certainly would not have taken it had I not seen what I saw on level 2.
Entry on the crosshairs; exit as detailed on chart. See broker screenshot for detailed entry/exit information.
Attachments
ashwani chadha
Junior member
- Messages
- 45
- Likes
- 1
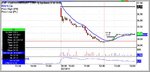
This is one of the trades I took today, BRCM.
There was clearly strong resistance at the $30 decade number. As the stock broke out at 1:40pm EST, it did so with strong force, as evidenced by the Time and Sales. Usually, stocks that break strong areas of support/resistance come back to re-test those areas. I waited for this re-test, and it was clear previous resistance had now become support. Once the 1:45pm candle broke the prior candle's high and Time and Sales confirmed my entry, I got an entry at $30.10. To add further to this high-probability trade, the NASDAQ 100 E-mini futures had broken their previous days high with strong conviction.
Exit was at $30.35 (as can be seen on the chart on the red cross hairs) due to massive selling pressure on the Time and Sales, or one could have trailed the stop using the EMA(10), which would have provided an exit at $30.36.
If trading 500 shares, this would have yielded $125; if trading 1000 shares, this would have yielded $250. Not bad for about 20 minutes in the market.
Thanks for reading! 🙂
thanks for sending this
amit1986
Experienced member
- Messages
- 1,100
- Likes
- 66
BIDU is doing sensationally today. I, of course, didn't trade it.
Several months ago, I was strongly contemplating going long BIDU as a long-term "buy and hold" trade as the company had a great daily chart along with strong fundamentals. It's making all time highs today. For what it's worth (and it probably is worth nothing) my opinion is that it is still dirt cheap*. But I have no experience in a "buy and hold" sort of trade so I will simply watch it.
*Note this is not trading/investing advice. It is just my opinion. Please don't trade based on what you read on T2W.
amit1986
Experienced member
- Messages
- 1,100
- Likes
- 66
For today's trading, I've got the following stocks to keep an eye on:
BBY, CSUN, DB, GME, MOBI, MU, PRGO, RHT, TEVA, TLB, TM, TSON.
Focus on clean, trending charts. The messier the chart, the higher the probability of getting chopped up on the trade.
BBY, CSUN, DB, GME, MOBI, MU, PRGO, RHT, TEVA, TLB, TM, TSON.
Focus on clean, trending charts. The messier the chart, the higher the probability of getting chopped up on the trade.
amit1986
Experienced member
- Messages
- 1,100
- Likes
- 66
Been a bit of a choppy, difficult morning. Results so far:
MU: +2 cents per shre
COF: +9 cents per share
Edit: COF was clearly an early exit. I entered the trade a little later than I would have liked, so was concerned as to a possible retracement. But it kept falling well after I closed my short. Oh well, it happens.
MU: +2 cents per shre
COF: +9 cents per share
Edit: COF was clearly an early exit. I entered the trade a little later than I would have liked, so was concerned as to a possible retracement. But it kept falling well after I closed my short. Oh well, it happens.
amit1986
Experienced member
- Messages
- 1,100
- Likes
- 66
+8 cents per share SCS reversal trade. Stock rose about 8% within the first half hour. Started to look weak on level 2 / t&s so I shorted it while having a very tight 3 cent stop based on market maker activity on level 2. It started ticking down and when it stopped, I covered.
market_bull
Active member
- Messages
- 188
- Likes
- 6
Very interesting journal, man. Thanks for sharing it. Caught your link from the signature on the "LuLz Crack Team of T2W" thread. 😉
amit1986
Experienced member
- Messages
- 1,100
- Likes
- 66
A quick, easy, simply breakdown trade just now using level 2 momentum. Reading level 2 wasn't even necessary as it was a clean, trending stock. Two-minute trade with a net profit of +30 cents per share.
Entry on the crosshairs; exit at time of screen shot.

The stock was restricted, which effectively meant that the up-tick rule was in place for this stock. Once the stock was ticking up, I saw selling pressure building, just before the bids fell, I shorted it and then it immediately went into profit.
Entry on the crosshairs; exit at time of screen shot.
The stock was restricted, which effectively meant that the up-tick rule was in place for this stock. Once the stock was ticking up, I saw selling pressure building, just before the bids fell, I shorted it and then it immediately went into profit.
Attachments
Mr. Charts
Legendary member
- Messages
- 7,370
- Likes
- 1,200
A quick, easy, simply breakdown trade just now using level 2 momentum. Reading level 2 wasn't even necessary as it was a clean, trending stock. Two-minute trade with a net profit of +30 cents per share.
Entry on the crosshairs; exit at time of screen shot.
View attachment 119228
The stock was restricted, which effectively meant that the up-tick rule was in place for this stock. Once the stock was ticking up, I saw selling pressure building, just before the bids fell, I shorted it and then it immediately went into profit.
Beautifully done, Amit :clap::clap::clap:
Richard
Mr. Charts
Legendary member
- Messages
- 7,370
- Likes
- 1,200
Thank you, Richard 😉
(Excellent job on CAT!)
That trade of yours was pure precision 🙂
Thanks, Amit - just posted chart of my first CAT trade elsewhere...... 😉
Richard
Similar threads
- Replies
- 512
- Views
- 76K
- Replies
- 9
- Views
- 6K